It is essential for patients with celiac disease (CD) to be on a gluten-free diet (GFD) but said diet has also been reported to increase the risk for metabolic syndrome. There is no evidence on the metabolic effects of a GFD in patients with nonceliac gluten sensitivity (NCGS) or in asymptomatic subjects. Therefore, the aim of the present study was to evaluate the metabolic effects of a GFD over a 6-month period in patients with CD, patients with NCGS, and in asymptomatic controls (ACs).
Materials and methodsA prospective study was conducted that evaluated metabolic syndrome and its components of obesity, high blood pressure, hepatic steatosis, and hyperglycemia at the baseline and at 6 months.
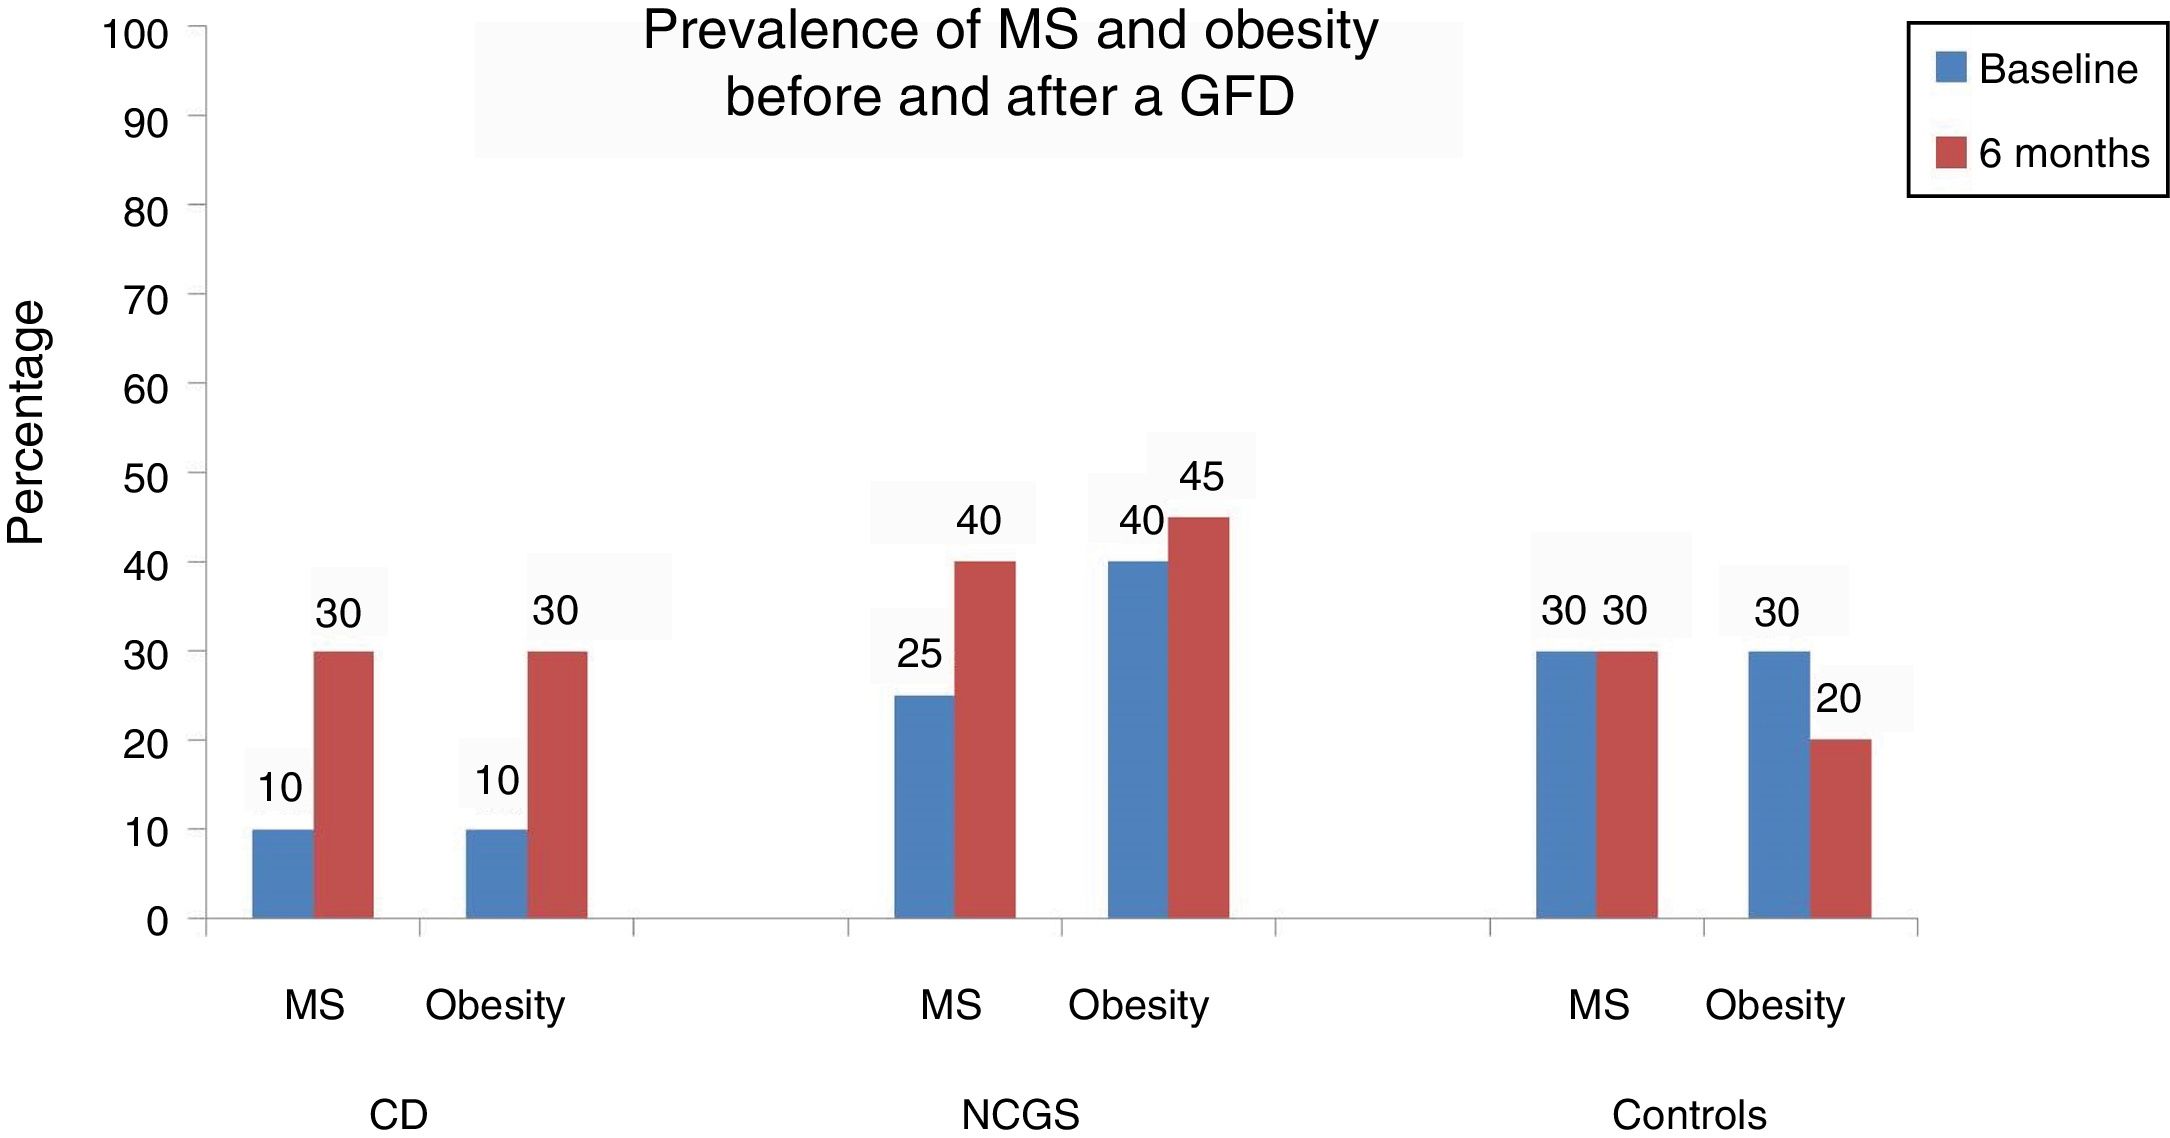
ResultsA total of 66 subjects (22 CD, 22 NCGS, and 22 AC) were included in the study. At the baseline, 10% of the patients with CD presented with obesity, high blood pressure, hepatic steatosis, and metabolic syndrome. After 6 months, obesity and metabolic syndrome increased by 20% (p=0.125). In the patients with NCGS, obesity increased by 5% after the GFD and 20% of those patients presented with de novo hepatic steatosis. The prevalence of obesity decreased by 10% in the controls after the GFD (30 vs 20%, p=0.5) and none of the other components of metabolic syndrome were affected.
ConclusionsThe metabolic benefits and risks of a GFD should be considered when prescribing said diet in the different populations that opt for that type of intervention.
La dieta libre de gluten (DLG) es indispensable para los pacientes con enfermedad celíaca (EC). Sin embargo, también se ha descrito que esta dieta aumenta el riesgo de síndrome metabólico (SM). La evidencia respecto a los efectos metabólicos de una DLG en pacientes con sensibilidad al gluten no celíaca (SGNC) y en sujetos asintomáticos se desconoce. El objetivo de este estudio fue evaluar los efectos metabólicos de una DLG durante 6 meses en pacientes con EC, SGNC y controles asintomáticos.
Material y métodosSe realizó un estudio prospectivo en donde de forma basal y a los 6 meses se evaluaron los componentes del SM como obesidad, esteatosis hepática, hiperglucemia e hipertensión arterial.
ResultadosSe incluyeron un total de 66 sujetos (22 EC, 22 SGNC y 22 controles asintomáticos). De forma basal el 10% de los pacientes con EC tuvo obesidad, SM, hipertensión y esteatosis hepática. Después de 6 meses el 20% de los pacientes desarrolló SM y obesidad (p=0.125). En los pacientes con SGNC la obesidad después de la DLG aumentó en un 5%, mientras que el 20% tuvo esteatosis hepática de novo. En el caso de los controles la DLG disminuyó la prevalencia de obesidad en un 10% (30% vs. 20%, p=0.5) sin afectar los otros componentes del SM.
ConclusionesLos beneficios y riesgos metabólicos de una DLG deben considerarse cuando se prescriben este tipo de dietas en las diferentes poblaciones que optan por este tipo de intervención.
Gluten-free diets (GFDs) have become very popular in recent years and increasingly more subjects adopt that type of diet, even if they do not need it.1 That is due to numerous factors that include the greater availability of gluten-free foods, the advertising carried out by the producers of said foods, the effect of press coverage, and the fact that some celebrities have adopted a gluten-free diet because they consider it “healthier” or that it can aid in weight loss.2 It is a fact that between 2004 and 2011 the sale of gluten-free products had an annual growth of nearly 28% and in 2012 there were close to 2.6 billion USD worth of sales of those products.3 Curiously, sales have increased in the subjects that think they have symptoms associated with gluten ingestion (nonceliac gluten sensitivity [NCGS]) but are not necessarily patients with celiac disease (CD).
There is no doubt that a GFD is indispensable for the treatment of patients with CD or gluten allergy, given that the improvement of symptoms and extraintestinal manifestations, correction and prevention of nutritional deficiencies (such as iron deficiency anemia and osteoporosis), and prevention of the development of gastrointestinal neoplasias, especially lymphomas, have been demonstrated with the implementation of a GFD.4–7 In addition, recent evidence has shown that patients with CD gain weight and increase their BMI after eliminating gluten from their diet.8,9 Nevertheless, there have also been reports that the continued use of that type of diet increases the risk for metabolic syndrome (MS) and cardiovascular diseases.10–13 It appears that a GFD unsupervised by a nutrition expert and based only on gluten-free products can contain a greater quantity of carbohydrates and fats, supplying more calories when compared with their gluten counterparts.14,15 This type of diet can also be deficient in certain vitamins and micronutrients, such as folic acid, magnesium, zinc, and vitamin B12,16,17 as well as having repercussions on the gut microbiota. In patients with CD on a GFD, a significant decrease in the diversity of the microbiota has been reported in the genera Lactobacillus and Bifidobacterium18 and a predominance in the phyla Actinobacteria, Bacteroidetes, and Firmicutes.19 In their study on healthy adults, De Palma et al.20 described the presence of changes in the gut microbiota after a GFD. The authors specifically found a significant decrease in the genus Bifidobacterium and the C. lituseburense and F. prausnitzii species and an increase in the E. coli species and Enterobacteriaceae family.
Thus, the adoption of a GFD out of the context of CD can have negative health repercussions. Furthermore, the metabolic effects of a GFD in patients with NCGS and in healthy subjects that wish to maintain a “healthier” lifestyle are unknown.
The aim of the present study was to evaluate the metabolic effects (weight, glycemia, lipid profile, high blood pressure, hepatic steatosis) of a 6-month GFD in a group of patients with CD, a group with NCGS, and a group of asymptomatic controls (ACs).
Materials and methodsPatientsA prospective and observational study was conducted that consecutively recruited subjects that came to the gastroenterology department of our hospital for the evaluation of symptoms suggestive of CD or NCGS. Patients with a known CD or NCGS diagnosis that were already on a GFD were excluded. The same baseline evaluation was performed on all subjects at that consultation (see further ahead). CD was diagnosed when, in the initial evaluation, patients tested positive for IgA tissue 2 transglutaminase antibodies (IgA-tTG2, Testline Clinical Diagnostics, Czech Republic) and/or IgG deaminated gliadin peptide antibodies (IgG-DGP, Testline Clinical Diagnostics), the presence of HLA-DQ2 and/or DQ8 haplotypes, and intestinal villous atrophy in duodenal biopsies according to the Marsh-Oberhüber classification.21
The presence of NCGS was suspected when the subjects had negative serology tests and biopsies in the initial evaluation but complained of symptoms related to gluten ingestion. Those subjects were evaluated by a gastroenterologist and a nutritionist, both of whom analyzed the gastrointestinal and/or extraintestinal symptoms (abdominal bloating, flatulence, bowel habit alterations, fatigue, headache, and muscle pain) and their relation to gluten intake utilizing the GSRS questionnaire.22 The GSRS questionnaire has previously been used to evaluate the presence of digestive symptoms and extraintestinal manifestations in patients with NCGS, and its use is recommended in the Salerno consensus.23 All the subjects were prescribed a GFD by a nutritionist and adherence to the diet was assessed through a food diary and weekly supervision for at least 6 weeks. NCGS diagnosis was made if the patients had a reduction > 30% in at least 3 of the symptoms evaluated in the GSRS for at least 50% of the time they were under observation (at least 3 of the 6 weekly evaluations). To confirm the NCGS diagnosis, all the subjects underwent a gluten challenge for 2 weeks (prescribed by the nutritionist, who recommended that the patient eat at least 8g of gluten daily). Finally, NCGS was corroborated when the patients reported the reappearance of the previously evaluated symptoms. For the purpose of the present analysis, the patients returned to a GFD after the gluten challenge phase of the study.
In addition, a group of subjects (controls with no digestive symptoms [the ACs]) that voluntarily wished to begin a GFD for the beneficial effects attributed to it were invited to participate. Those subjects were asymptomatic but could present with obesity and they underwent the same baseline evaluation as the patients with CD and NCGS.
ProtocolBaseline evaluationA baseline clinical evaluation and physical examination were performed on all the subjects to assess the presence of gastrointestinal symptoms and signs of organicity. All the patients underwent serology testing for CD and duodenal biopsies to evaluate intestinal atrophy, and the following metabolic assessments were carried out: waist circumference measurement (cm) (according to the WHO protocol),24 body mass index (BMI) (kg/m2), and blood pressure (mm Hg), as well as the determination of glycemia (mg/dl), total cholesterol (mg/dl), HDL (mg/dl), triglycerides (mg/dl), aspartate aminotransferase (AST, IU/ml), and alanine aminotransferase (ALT, IU/ml), with the patients fasting beforehand.
MS diagnosis was made according to the criteria of the Asociación Latinoamericana de Diabetes (ALAD),25 which defines abdominal obesity as an increase in abdominal circumference (≥ 94cm in men and ≥ 88cm in women) plus 2 of the following 4 criteria: a) elevated triglyceride value > 150mg/dl, b) low HDL cholesterol < 40mg/dl in men and < 50mg/dl in women, c) elevated blood pressure (BP) with systolic BP (SBP) > 130mmHg and/or diastolic BP (DBP) > 85mmHg, and d) altered glucose regulation (fasting glucose > 100mg/dl), glucose intolerance, or diabetes. Patients were also classified according to the WHO criteria as: a) normal (BMI 18.5-24.9kg/m2), overweight (BMI 25-29.9kg/m2), and obese (BMI ≥30kg/m2).26
Hepatic steatosis diagnosis was made through ultrasound imaging according to previously established criteria: 1) no steatosis, 2) mild (attenuation slightly lower than that of the spleen), 3) moderate (pronounced attenuation between the liver and spleen and non-visualization of the intrahepatic vessels), and 4) severe (marked decrease in the hepatic attenuation with a strong contrast between the liver and intrahepatic vessels).27 The procedure was carried out by the same experienced ultrasonographer.
InterventionAll the subjects received recommendations for carrying out a GFD prescribed by a nutritionist (described above) at the baseline. They were then given appointments every 3 months for 6 months. Adherence to the diet was evaluated through a questionnaire that took into consideration the foods consumed by the patient the week prior to the visit. In cases of doubt or symptom relapse, CD antibodies were determined in selected patients.
Final evaluationAt the end of the 6 months, all the baseline evaluations were repeated, including the clinical evaluation, the metabolic profile, and the ultrasound imaging to assess the development of obesity, MS, and hepatic steatosis before and after the GFD.
Statistical analysisDescriptive statistics were employed, and the chi-square test, Mann-Whitney U test, ANOVA or Kruskal-Wallis test, and the Wilcoxon signed rank test were used for the group comparisons, when indicated. The odds ratio was also used to quantify the statistical difference between dichotomous variables. All the differences were considered statistically significant with a p < 0.05. The analysis was performed utilizing the SPSS, version 21.0 (SPSS Inc, Chicago IL, USA) software. Sample size was calculated based on the study by Tortora et al.,10 in which a GFD in patients with CD produced a 30% prevalence of MS after one year. Assuming said increment in the 3 groups, the baseline number was calculated at n = 22 patients per group. Informed consent was obtained from all the participants and the study was approved by the institutional ethics committee. It was funded by a grant from the CONACYT (FOSIS 2015-262023).
ResultsInitially, there was a total of 66 study subjects: 22 patients with CD, 22 patients with NCGS, and 22 ACs. The protocol was completed with 60 subjects (a 9% loss), 20 subjects in each of the 3 groups analyzed. Two patients with CD were lost to follow-up because they could not attend the follow-up visits, whereas 2 subjects with NCGS and two ACs abandoned the study because they could not adhere to the protocol.
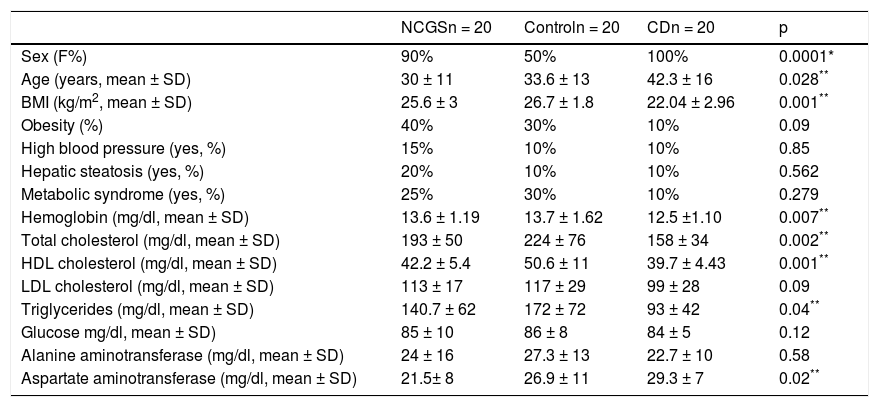
Table 1 shows the demographic characteristics of the subjects in each study group. The patients with CD were older (p = 0.028), had a lower BMI (p = 0.001), lower hemoglobin levels (p = 0.007), lower total cholesterol (p = 0.002), lower HDL cholesterol (p = 0.001), lower triglycerides (p = 0.04), and higher AST levels (p = 0.020), compared with the other groups. There were more men in the control group (p = 0.001), as well as a greater prevalence of baseline MS (30%, nonsignificant p). There were no differences between the 3 groups with respect to the prevalence of baseline obesity, hepatic steatosis, MS, and high blood pressure.
Demographic characteristics and metabolic syndrome and its components in the 3 groups.
| NCGSn = 20 | Controln = 20 | CDn = 20 | p | |
|---|---|---|---|---|
| Sex (F%) | 90% | 50% | 100% | 0.0001* |
| Age (years, mean ± SD) | 30 ± 11 | 33.6 ± 13 | 42.3 ± 16 | 0.028** |
| BMI (kg/m2, mean ± SD) | 25.6 ± 3 | 26.7 ± 1.8 | 22.04 ± 2.96 | 0.001** |
| Obesity (%) | 40% | 30% | 10% | 0.09 |
| High blood pressure (yes, %) | 15% | 10% | 10% | 0.85 |
| Hepatic steatosis (yes, %) | 20% | 10% | 10% | 0.562 |
| Metabolic syndrome (yes, %) | 25% | 30% | 10% | 0.279 |
| Hemoglobin (mg/dl, mean ± SD) | 13.6 ± 1.19 | 13.7 ± 1.62 | 12.5 ±1.10 | 0.007** |
| Total cholesterol (mg/dl, mean ± SD) | 193 ± 50 | 224 ± 76 | 158 ± 34 | 0.002** |
| HDL cholesterol (mg/dl, mean ± SD) | 42.2 ± 5.4 | 50.6 ± 11 | 39.7 ± 4.43 | 0.001** |
| LDL cholesterol (mg/dl, mean ± SD) | 113 ± 17 | 117 ± 29 | 99 ± 28 | 0.09 |
| Triglycerides (mg/dl, mean ± SD) | 140.7 ± 62 | 172 ± 72 | 93 ± 42 | 0.04** |
| Glucose mg/dl, mean ± SD) | 85 ± 10 | 86 ± 8 | 84 ± 5 | 0.12 |
| Alanine aminotransferase (mg/dl, mean ± SD) | 24 ± 16 | 27.3 ± 13 | 22.7 ± 10 | 0.58 |
| Aspartate aminotransferase (mg/dl, mean ± SD) | 21.5± 8 | 26.9 ± 11 | 29.3 ± 7 | 0.02** |
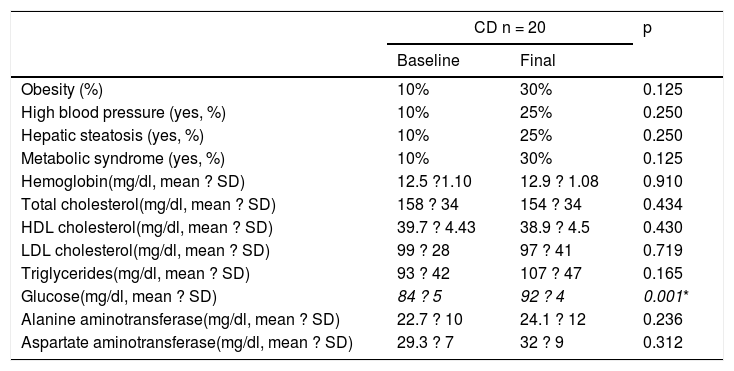
Table 2 and Figure 1 show the prevalence of MS before and after the GFD in the 3 groups. Ten percent of the patients with CD had baseline obesity, MS, high blood pressure, and steatosis. After 6 months, 20% of the patients developed MS and obesity (p = 0.125) (fig. 1). There was a significant increase in BMI from 22.04 ± 2.96kg/m2 to 24.5 ± 1.98 after the GFD (p = 0.001). Upon finishing the GFD, 25% of the patients with CD had steatosis and high blood pressure (15%, p = 0.125). Grade was mild, in the 5 cases with hepatic steatosis. In the patients with CD, the only altered biochemical parameter after 6 months of the GFD was glucose (p = 0.001).
Metabolic syndrome and its components before and after 6 months of a gluten-free diet in patients with celiac disease.
| CD n = 20 | p | ||
|---|---|---|---|
| Baseline | Final | ||
| Obesity (%) | 10% | 30% | 0.125 |
| High blood pressure (yes, %) | 10% | 25% | 0.250 |
| Hepatic steatosis (yes, %) | 10% | 25% | 0.250 |
| Metabolic syndrome (yes, %) | 10% | 30% | 0.125 |
| Hemoglobin(mg/dl, mean ? SD) | 12.5 ?1.10 | 12.9 ? 1.08 | 0.910 |
| Total cholesterol(mg/dl, mean ? SD) | 158 ? 34 | 154 ? 34 | 0.434 |
| HDL cholesterol(mg/dl, mean ? SD) | 39.7 ? 4.43 | 38.9 ? 4.5 | 0.430 |
| LDL cholesterol(mg/dl, mean ? SD) | 99 ? 28 | 97 ? 41 | 0.719 |
| Triglycerides(mg/dl, mean ? SD) | 93 ? 42 | 107 ? 47 | 0.165 |
| Glucose(mg/dl, mean ? SD) | 84 ? 5 | 92 ? 4 | 0.001* |
| Alanine aminotransferase(mg/dl, mean ? SD) | 22.7 ? 10 | 24.1 ? 12 | 0.236 |
| Aspartate aminotransferase(mg/dl, mean ? SD) | 29.3 ? 7 | 32 ? 9 | 0.312 |

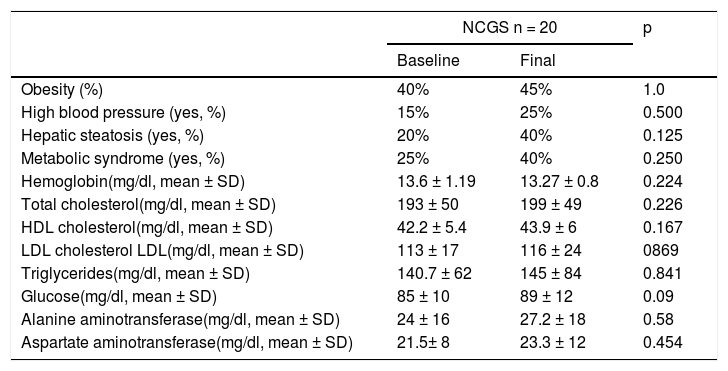
In the subjects with NCGS, the increase in the presence of obesity before and after the GFD was 5% (40% vs. 45%, p = 1.0), and it was 15% (25% vs. 40%, p = 0.25) for MS. The mean BMI before and after the 6 months of GFD was similar (25.6 ± 4kg/m2 and 25.9 ± 2.34kg/m2, p = 0.87) (Table 3). The increase in the prevalence of high blood pressure was 10% and the increase in the prevalence of steatosis was 20% (20% vs. 40%, p = 0.125). Of the 8 patients with hepatic steatosis, the grade was mild in 6 patients and moderate in 2 cases. From the statistical perspective, there was a trend toward an increase in glucose levels after carrying out the GFD (p = 0.09).
Metabolic syndrome and its components before and after 6 months of a gluten-free diet in patients with nonceliac gluten sensitivity.
| NCGS n = 20 | p | ||
|---|---|---|---|
| Baseline | Final | ||
| Obesity (%) | 40% | 45% | 1.0 |
| High blood pressure (yes, %) | 15% | 25% | 0.500 |
| Hepatic steatosis (yes, %) | 20% | 40% | 0.125 |
| Metabolic syndrome (yes, %) | 25% | 40% | 0.250 |
| Hemoglobin(mg/dl, mean ± SD) | 13.6 ± 1.19 | 13.27 ± 0.8 | 0.224 |
| Total cholesterol(mg/dl, mean ± SD) | 193 ± 50 | 199 ± 49 | 0.226 |
| HDL cholesterol(mg/dl, mean ± SD) | 42.2 ± 5.4 | 43.9 ± 6 | 0.167 |
| LDL cholesterol LDL(mg/dl, mean ± SD) | 113 ± 17 | 116 ± 24 | 0869 |
| Triglycerides(mg/dl, mean ± SD) | 140.7 ± 62 | 145 ± 84 | 0.841 |
| Glucose(mg/dl, mean ± SD) | 85 ± 10 | 89 ± 12 | 0.09 |
| Alanine aminotransferase(mg/dl, mean ± SD) | 24 ± 16 | 27.2 ± 18 | 0.58 |
| Aspartate aminotransferase(mg/dl, mean ± SD) | 21.5± 8 | 23.3 ± 12 | 0.454 |
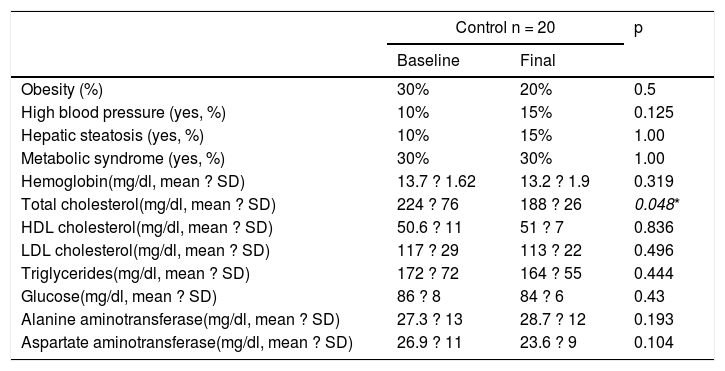
Finally, in the control subject group, the GFD produced a 10% decrease in the prevalence of obesity (30% vs. 20%, p = 0.5) and the BMI decreased significantly from 26.7 ± 1.8kg/m2 to 25.1± 1.76kg/m2 after the GFD (p = 0.001) (Table 4). However, the prevalence of MS remained stable throughout the study and the prevalence of high blood pressure and steatosis increased 5%. In the 3 patients with hepatic steatosis, the grade was mild and did not change in relation to the baseline stage. There were no significant differences in the biochemical parameters, except in the total cholesterol levels (p = 0.048).
Metabolic syndrome and its components before and after 6 months of a gluten-free diet in asymptomatic subjects.
| Control n = 20 | p | ||
|---|---|---|---|
| Baseline | Final | ||
| Obesity (%) | 30% | 20% | 0.5 |
| High blood pressure (yes, %) | 10% | 15% | 0.125 |
| Hepatic steatosis (yes, %) | 10% | 15% | 1.00 |
| Metabolic syndrome (yes, %) | 30% | 30% | 1.00 |
| Hemoglobin(mg/dl, mean ? SD) | 13.7 ? 1.62 | 13.2 ? 1.9 | 0.319 |
| Total cholesterol(mg/dl, mean ? SD) | 224 ? 76 | 188 ? 26 | 0.048* |
| HDL cholesterol(mg/dl, mean ? SD) | 50.6 ? 11 | 51 ? 7 | 0.836 |
| LDL cholesterol(mg/dl, mean ? SD) | 117 ? 29 | 113 ? 22 | 0.496 |
| Triglycerides(mg/dl, mean ? SD) | 172 ? 72 | 164 ? 55 | 0.444 |
| Glucose(mg/dl, mean ? SD) | 86 ? 8 | 84 ? 6 | 0.43 |
| Alanine aminotransferase(mg/dl, mean ? SD) | 27.3 ? 13 | 28.7 ? 12 | 0.193 |
| Aspartate aminotransferase(mg/dl, mean ? SD) | 26.9 ? 11 | 23.6 ? 9 | 0.104 |
Regarding symptom evaluation, 18 of the 20 (90%) patients with CD reported improvement in pain and bloating greater than 50% during the GFD and 15 of the 20 patients with NCGS did the same (75%). Adherence to the diet was 95% in the patients with CD, 80% in the patients with NCGS, and 80% in the controls.
Discussion and conclusionsIn the present study, we evaluated the metabolic effects of a GFD on 3 populations that currently consume that restriction diet: patients with CD, patients that complain of symptoms resulting from gluten ingestion (NCGS), and a population considered “asymptomatic” from a digestive perspective that selected said diet for its supposed metabolic benefits. Even though there are previous studies on the metabolic effects of a GFD, ours is the first to evaluate them in subjects with NCGS and in ACs.10
Our results showed that the metabolic impact of a GFD was different in the 3 populations studied, signifying that the recommendation of that type of diet must be adaptable, and the potential risks and benefits explained to the subjects.
The first observation to be underlined is that the patients with CD had lower baseline weight and nutritional status (lower hemoglobin, cholesterol, and triglyceride levels) than the patients with NCGS. That finding is consistent with results reported in other studies, with respect to nutritional deficiencies that CD induces in the long term.4–7 It is also important to emphasize that the patients had higher baseline levels of AST, which as reported in other cases series, can be part of the spectrum of extradigestive manifestations of CD.28
The effects of the 6-month GFD in patients with CD produced a significant increase in the BMI and the prevalence of MS, the same as was reported by Tortora et al.10 and in other case series.29,30 That increase in weight reflects histologic improvement and better nutrient absorption. Even though weight gain is an improvement parameter in patients with CD, there is a risk that if it is not controlled, patients can develop obesity, as occurred in 20% of our patients at the end of month 6 of the GFD. In a study on 389 adult patients with CD that were on a GFD for a mean 2.8 years, 27% of the patients with initial obesity or overweight, gained even more weight.29 In another similar study, 82% of patients with CD presented with secondary weight gain and overweight after following a GFD.8
It is important to remember that a GFD excludes the intake of wheat, which is one of the main sources of fiber. Wheat naturally contains fructan starches, such as oligofructose and inulin, which are beneficial for the creation of a healthy microbiota. Those compounds interact with the gut bacteria in the colon and can protect the intestine from certain neoplasias, as well as inflammatory and cardiovascular diseases.30 Undigestible carbohydrates derived from wheat reduce postprandial glycemia and insulinemia, fasting triglycerides, and body weight. Oligofructose has been shown to improve the immune status, lipid metabolism, and vitamin and mineral absorption.30,31 Tissular transglutaminase has recently been described to down-regulate the inflammation pathways mediated by the PPAR receptors involved in the pathogenesis of insulin resistance. A GFD likely produces an up-regulation of those pathways that are related to type 2 diabetes mellitus susceptibility.32 That could be the mechanism explaining the hyperglycemia that apparently results from the elimination of gluten in some patients, as occurred in our study. Tortora et al.10 have also reported similar findings. Nevertheless, that theory must be evaluated more thoroughly. With respect to the lipid profile, we found no differences before or after the GFD, as reported in other studies, which could be related to the fact that 6 months of a diet cannot completely reflect that type of alteration.33,34
On the other hand, there was an increase in our analysis in the prevalence of hepatic steatosis after 6 months of a GFD in patients with CD, as recently shown by Tovoli F et al.35 In their study on a cohort of 202 patients with CD on a GFD and 202 controls, the prevalence of hepatic steatosis was 34.7% vs. 21.8% (p = 0.006). Hepatic steatosis susceptibility in patients with CD, as well as in the general population, has recently been associated with polymorphisms related to the PNPLA3 gene.36
It should also be mentioned that gluten can have a favorable effect on maintaining normal blood pressure. For example, wheat gliadin hydrolysates have been reported to inhibit the type I angiotensin-converting enzyme. Consequently, the absence of gluten could predispose some patients to develop high blood pressure, as occurred in 15% of our patients with CD.37
Unlike CD, NCGS is seen as a “symptomatic” disease with no risks or complications. However, the long-term effect that excluding gluten from the diet of those patients is unknown. NCGS appears to be more frequent (6% of the population) than CD, and even though the pathophysiologic mechanisms are not known, alterations in intestinal permeability and the production of interleukins and other cytokines have been described, unlike that demonstrated in patients with CD, suggesting the preponderant participation of the innate immune system.38 In addition to gluten, other proteins present in cereals, such as trypsin-amylase inhibitors, lecithin, and exotoxins, have been posited as possible causes of NCGS.7,29
Our study is the first to show that patients with NCGS that were exposed to a GFD could have metabolic effects, such as a 20% increase in the development of hepatic steatosis, a 15% increase in MS, and a 10% increase in cases of high blood pressure. Even though the changes were not statistically significant, they were still of interest, and patients with NCGS that go on a GFD should be advised of those situations. Unlike that observed in the patients with CD, the development of obesity was lower in the patients with NCGS. Although The metabolic effects of a GFD on patients with NCGS could be the same as those described in patients with CD, but the fact that NCGS is an entity with a different pathophysiology, those effects are most likely associated with other mechanisms. The consumption of a GFD has recently been described to possibly modify the gut microbiota, thus producing harmful metabolic effects. In a study on 10 healthy volunteers on a GFD for one month, a significant decrease in Bifidobacterium, Lactobacillus, Clostridium lituseburense, and Faecalibacterium prausnitzii and a significant increase in Enterobacteriaceae and E. coli were reported.20 In contrast to that study, a greater consumption of whole wheat is related to an increase in the microbiota that is associated with beneficial health effects. For example, in a double-blind, randomized, cross-over study consisting of 2 diets for 3 weeks (with a wash-out period of 2 weeks between them), 31 healthy men and women added either 48g/day of 100% whole grain wheat or 48g/day of cereal with wheat bran. After 3 weeks of the diet supplemented with 48g/day of whole grain wheat, the concentration of bifidobacteria increased by 10%, whereas the addition of wheat bran to the customary diets of the subjects did not have that effect. Both 100% whole grain wheat and wheat bran produced an increase in the number of lactobacilli in stool samples.39
Finally, our study described the effects of a GFD on a group of asymptomatic controls that opted for that type of diet with the aim of achieving metabolic benefits. The only important effect of that diet in the ACs was a slight decrease in weight, with no significant changes in MS and its components. The results were similar to those based on the US National Health and Nutrition Examination Survey (NHANES), in which 155 nonceliac patients that had chosen a GFD were compared with the general population.40 The subjects that opted for a GFD as a lifestyle had a slight decrease in weight over a one-year period (1.33 kgs) and no other effect on the development of MS or cardiovascular risk at 10 years. It should be stated that even though weight loss could be a recommendation for opting for a GFD, diet adherence and costs should be considered in that decision.
With respect to our results and conclusions, our study limitations must be mentioned. First, the evaluation was carried out during a period of 6 months, a time frame that most likely was not quite long enough for some of the metabolic effects to appear. However, the nature of this type of study and its follow-up are complex. Furthermore, even though diet adherence by the patients was determined through a questionnaire that evaluated the foods consumed in the week prior to the consultations, it is probable that there were dietary transgressions not reported by the patients. In addition, physical activity and exercise were not controlled, which could have had an influence on the development of the metabolic complications of our patients. Another limitation, specifically in the patients with NCGS, is the fact that the diagnoses were based on an adaptation of the Salerno protocol.5 The complete performance of that protocol requires a 6-week surveillance period and then a double-blind challenge of foods with and without gluten, which is very complicated to carry out in clinical practice, and its usefulness has recently been questioned.41 However, CD was reasonably ruled out in all our patients and therefore we believe our population is representative of that entity. We must also recognize that our patients with NCGS could belong to the group of patients with irritable bowel syndrome that have symptoms associated with gluten or unfermentable oligosaccharides, albeit that is a controversial subject that is still being studied. Finally, the diagnosis of steatosis was made by a single radiologist, resulting in the risk for bias and variability. In addition, there are currently better tools for the diagnosis of hepatic steatosis, such as hepatic elastography.
In conclusion, there was an increase in the prevalence of MS after a 6-month GFD in 20% of the patients with CD in the present study, concurring with that described in other populations. In patients with NCGS, that increase was 15%, as well as a 20% increase in steatosis and no important changes related to weight. The GDF did not provide metabolic benefits in the NCGS patients and potentially conferred a risk. Regarding the asymptomatic subjects, even though the GFD produced a 10% decrease in obesity, it was not associated with any other metabolic advantage. Therefore, the metabolic benefits and risks of a GFD should be considered when prescribing that type of diet.
Financial disclosureCONACYT, Mexico, FOSIS 2015-262023.
Conflict of interestDr. José María Remes-Troche: is a member of the advisory board of Takeda Pharmaceuticals, Alfa-Wassermann, and Almirall. He received funds for research for Sanfer. He is a speaker for Takeda, Asofarma, Alfa-Wassermann, Carnot, Almirall, and Astra-Zeneca. The physicians Orestes de Jesus Cobos-Quevedo, Xaira Rivera-Gutierrez, Gildardo Hernández, Elí de la Cruz Patiño, and Luis F. Uscanga Domínguez are members of the advisory board of Asofarma.
Please cite this article as: Remes-Troche JM, Cobos-Quevedo ODJ, Rivera-Gutiérrez X, Hernández G, de la Cruz-Patiño E, Uscanga-Domínquez LF. Efectos de una dieta libre de gluten (DLG) durante 6 meses sobre el metabolismo en pacientes con enfermedad celíaca, sensibilidad al gluten no celíaca y controles asintomáticos. Revista de Gastroenterología de México. 20250;85:109–117.

