Insulin resistance and diabetes mellitus are frequently associated with chronic hepatitis C virus (HCV) infection, and it is thought that the presence of insulin resistance aggravates liver disease. We aimed to evaluate insulin resistance in nondiabetic Egyptian patients with chronic HCV infection.
Materials and methodsSixty nondiabetic patients with chronic HCV infection and 30 healthy nondiabetic non-HCV-infected volunteers were enrolled in our study. They were divided into 3 groups: group 1 included 30 patients with chronic HCV infection with no cirrhosis, group 2 included 30 patients with chronic HCV infection and cirrhosis of the liver, and group 3 included 30 healthy volunteers as controls. The entire study population underwent a detailed clinical history and physical examination, weight and height measurement, routine laboratory tests, and viral marker determination that included hepatitis B surface antigen and HCV antibodies. PCR analysis was carried out on the patients with positive HCV antibodies. Fasting blood sugar and fasting insulin levels were measured in all the patients, and insulin resistance was calculated according to the homeostasis model assessment of insulin resistance (HOMA-IR).
ResultsPatients with cirrhosis of the liver (2 patients with Child class A, 12 patients with Child class B, and 16 patients with Child class C) showed higher insulin resistance levels (2.76±0.97) than the patients with chronic HCV infection and no cirrhosis (2.03±0.743) and the control group (1.22±0.38). The p value was significantly different between the 3 groups. There were direct and significant correlations between insulin resistance, fasting blood sugar, and fasting insulin levels. Patients with chronic HCV infection showed significantly higher fasting insulin and glucose levels than the control group.
ConclusionChronic HCV-infected patients showed significantly higher insulin resistance levels than the normal population, even in the absence of hepatic dysfunction and cirrhosis.
La resistencia a la insulina y la diabetes mellitus están frecuentemente asociadas con la infección por virus de hepatitis C crónica (VHC), y se piensa que la presencia de la resistencia a la insulina agrava la enfermedad hepática. Nuestro objetivo fue evaluar la resistencia a la insulina en pacientes egipcios no diabéticos con infección crónica de VHC.
Materiales y métodosReclutamos a 60 pacientes no diabéticos con infección de VHC crónica y a 30 voluntarios no diabéticos sin infección de VHC. El estudio se dividió en 3 grupos: el grupo 1 incluyó a 30 pacientes con infección de VHC crónica sin cirrosis, el grupo 2 incluyó a 30 pacientes con infección de VHC crónica y cirrosis hepática, mientras que el grupo 3 estuvo conformado por los voluntarios sanos como grupo control. Se realizó una detallada historia clínica y examen físico de toda la población del estudio, incluidos peso y altura, pruebas de laboratorio de rutina, y determinación de marcadores virales que incluyeron el antígeno de superficie de hepatitis B y anticuerpos de VHC. Se llevó a cabo un análisis PCR en los pacientes con VHC positivo. Se midieron los niveles de glucosa en sangre en ayuno y los niveles de insulina en ayuno de todos los pacientes y se calculó la resistencia a la insulina de acuerdo a la evaluación del modelo homeostático de resistencia a la insulina (HOMA-IR por sus siglas en inglés).
ResultadosLos pacientes con cirrosis hepática (2 pacientes de clase Child A, 12 pacientes de clase Child B y 16 pacientes de clase Child C) presentaron niveles más altos de resistencia a la insulina (2.76±0.97) que los pacientes con infección VHC crónica sin cirrosis (2.03±0.743) y que el grupo control (1.22±0.38). El valor de p fue significativamente diferente entre los tres grupos. Existieron correlaciones directas y significativas entre la resistencia a la insulina, la glucosa en sangre en ayuno y los niveles de insulina en ayuno. Los pacientes con infección de VHC crónica presentaron niveles de glucosa e insulina en ayunos significativamente más altos que el grupo control.
Conclusiónlos pacientes con infección de VHC crónica presentaron niveles de resistencia a la insulina significativamente más altos que la población normal, incluso en la ausencia de disfunción hepática y cirrosis.
Hepatitis C virus (HCV) infection is a major cause of liver diseases and related morbidities and mortalities. More than 170 million persons are infected worldwide.1 Most patients pass insidiously from the acute stage to the chronic stage, with an increased risk of viral transmission to others.2 HCV not only affects the liver, but is also associated with many extrahepatic manifestations, including insulin resistance (IR).3
IR is a pathologic condition that appears when a higher insulin concentration is needed for a normal physiologic glycemic response and adequate tissue utilization.4 It is usually associated with obesity and metabolic syndrome and is a risk factor for the development of type 2 diabetes mellitus, kidney diseases, cardiovascular diseases, and infection.5 In addition, IR is frequently associated with HCV infection.6,7 The development of IR in patients with no liver disease is associated with a sedentary lifestyle and a high-calorie diet, whereas in patients with HCV infection, it is usually associated with hepatic inflammation, increased inflammatory cytokines, and impaired insulin and lipid hemostasis. Thus, IR is higher in HCV-infected patients than in the general population and patients with non-HCV-related liver diseases.8,9 The development of IR in HCV-infected patients is linked to increased HCV-related morbidities, such as steatosis, fibrosis, hepatocellular carcinoma, and resistance to antiviral therapy.10 IR occurs very early in transgenic HCV-infected mice and even precedes the occurrence of steatosis.11 Similar results have been observed in humans, signifying that IR is not a consequence of hepatic steatosis.12 IR in HCV-infected patients is a therapeutic target for decreasing HCV-related morbidities and increasing the antiviral response.13
The aim of the present study was to assess the prevalence of IR in patients with chronic HCV infection.
Materials and methodsA cross-sectional case-control study was conducted at the Tropical Medicine and Gastroenterology Department of the Al-Azhar-Assiut University Hospital. It included 90 nondiabetic subjects that were classified into 3 groups: group 1 was made up of 30 adult patients with chronic HCV infection with no cirrhosis of the liver, group 2 consisted of 30 patients with post-chronic HCV infection cirrhosis of the liver (2 patients with Child class A, 12 patients with Child class B, and 16 patients with Child class C), and group 3 was made up of 30 healthy subjects as controls.
Inclusion criteria for the patient groupsThe study included all adult patients that presented with chronic HCV infection confirmed by positive anti-HCV antibodies and PCR, for 6 months or more.
Exclusion criteria for the patient groupsChildren, diabetics, subjects that were taking or had taken anti-HCV drugs, patients with HCV and hepatitis B virus coinfection, patients infected with human immunodeficiency virus, subjects taking lipid lowering agents, patients with hepatocellular carcinoma, subjects with high blood pressure or a BMI>25kg/m2, persons with hyperlipidemia, patients with nonalcoholic fatty liver disease, patients with chronic liver diseases other than HCV infection, pregnant women, breast-feeding women, and subjects with a history of bariatric surgery were all excluded from the study.
All patients and controls underwent a detailed clinical history and examination, emphasizing the manifestations of chronic liver diseases. Weight and height of the study participants were measured, as well.
Laboratory test assessmentThe following laboratory analyses were performed: complete blood count (CBC), aspartate aminotransferase, alanine aminotransferase, bilirubin, albumin, prothrombin time, prothrombin concentration, urea, creatinine, alpha-fetoprotein, fasting insulin, fasting blood sugar, and 2-h postprandial blood sugar.
Abdominal ultrasoundAbdominal ultrasound was carried out on all patients and controls to confirm cirrhosis in group 2 and to exclude non-alcoholic fatty liver in both group 1 and the control group. Imaging was focused on the brightness of the liver (fatty liver) and signs of chronic liver diseases, such as echotexture and homogeneity of the liver, dilated portal vein or portosystemic collaterals, splenomegaly, and ascites.
Calculation of insulin resistanceIR was calculated using the homeostasis model for the assessment of IR (HOMA-IR) equation: IR=fasting insulin (uU/ml)×fasting glucose (mmol/l)/22.5. IR was diagnosed if the HOMA-IR was equal to or greater than 2.7.14–17
Ethical considerationsThe study was approved by the Al-Azhar-Assiut-Faculty of Medicine ethics committee. Informed consent was obtained from each of the study participants. The authors declare that the present article does not contain personal information that would enable patient identification.
Financial supportNo financial support was received in relation to the present study.
Statistical analysisThe statistical analysis was carried out using the Windows 10 SPSS version 25 (IBM SPSS Inc., Chicago, USA) program. The categorical data were expressed as number and percentage and the numerical data as mean and standard deviation. The ANOVA and post hoc tests were used to compare the numerical data between groups, and the Mann-Whitney U test and Kruskal-Wallis test for comparing the categorical data. A regression analysis was done to predict factors affecting IR in chronic HCV-infected patients. Statistical significance was set at a p value less than or equal to 0.05.
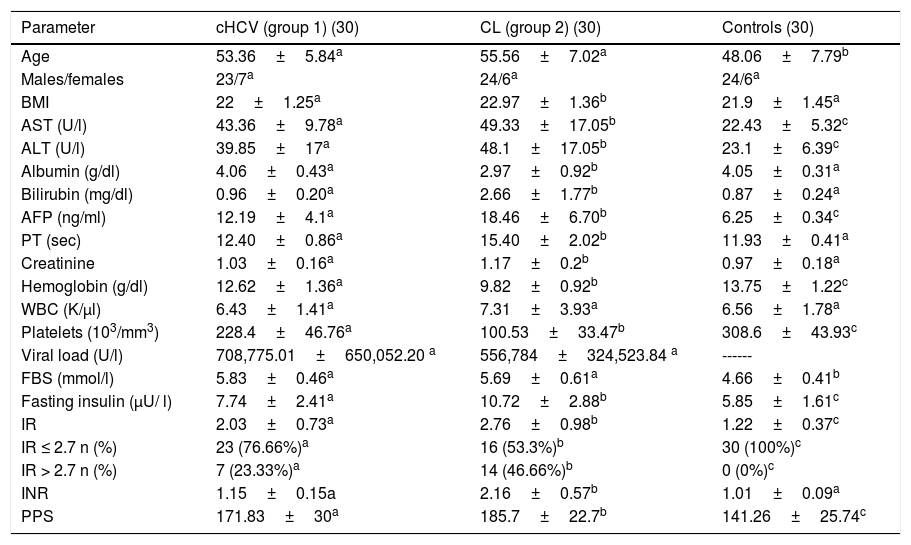
ResultsPatient characteristicsOur study included 60 chronic HCV-infected patients and 30 healthy volunteers. Patient demographic and laboratory test data are listed in Table 1. Fasting serum insulin and glucose levels were significantly higher in group 2 (liver cirrhosis group: 2 patients with Child class A, 12 patients with Child class B, and 16 patients with Child class C) than in group 1 (chronic HCV-infected non-cirrhotic patients) and in group 3 (controls). When utilizing 2.7 as the cutoff point for IR, group 2 showed a prevalence of IR as high as 46.66% versus 23.33% for group 1, whereas it was 0% for the control group.
Demographic and laboratory test characteristics of the study population.
| Parameter | cHCV (group 1) (30) | CL (group 2) (30) | Controls (30) |
|---|---|---|---|
| Age | 53.36±5.84a | 55.56±7.02a | 48.06±7.79b |
| Males/females | 23/7a | 24/6a | 24/6a |
| BMI | 22±1.25a | 22.97±1.36b | 21.9±1.45a |
| AST (U/l) | 43.36±9.78a | 49.33±17.05b | 22.43±5.32c |
| ALT (U/l) | 39.85±17a | 48.1±17.05b | 23.1±6.39c |
| Albumin (g/dl) | 4.06±0.43a | 2.97±0.92b | 4.05±0.31a |
| Bilirubin (mg/dl) | 0.96±0.20a | 2.66±1.77b | 0.87±0.24a |
| AFP (ng/ml) | 12.19±4.1a | 18.46±6.70b | 6.25±0.34c |
| PT (sec) | 12.40±0.86a | 15.40±2.02b | 11.93±0.41a |
| Creatinine | 1.03±0.16a | 1.17±0.2b | 0.97±0.18a |
| Hemoglobin (g/dl) | 12.62±1.36a | 9.82±0.92b | 13.75±1.22c |
| WBC (K/μl) | 6.43±1.41a | 7.31±3.93a | 6.56±1.78a |
| Platelets (103/mm3) | 228.4±46.76a | 100.53±33.47b | 308.6±43.93c |
| Viral load (U/l) | 708,775.01±650,052.20 a | 556,784±324,523.84 a | ------ |
| FBS (mmol/l) | 5.83±0.46a | 5.69±0.61a | 4.66±0.41b |
| Fasting insulin (μU/ l) | 7.74±2.41a | 10.72±2.88b | 5.85±1.61c |
| IR | 2.03±0.73a | 2.76±0.98b | 1.22±0.37c |
| IR ≤ 2.7 n (%) | 23 (76.66%)a | 16 (53.3%)b | 30 (100%)c |
| IR > 2.7 n (%) | 7 (23.33%)a | 14 (46.66%)b | 0 (0%)c |
| INR | 1.15±0.15a | 2.16±0.57b | 1.01±0.09a |
| PPS | 171.83±30a | 185.7±22.7b | 141.26±25.74c |
AFP: alpha-fetoprotein; ALT: alanine aminotransferase; AST: aspartate aminotransferase; BMI: body mass index; cHCV: chronic hepatitis C virus (group 1); CL: cirrhosis of the liver (group 2); FBS: fasting blood sugar; INR: international normalized ratio; IR: insulin resistance; PPS: postprandial sugar; PT: prothrombin time; WBC: white blood cell count.
a,b,c There were statistically significant differences between the groups with different letters, but not between those with the same letter.
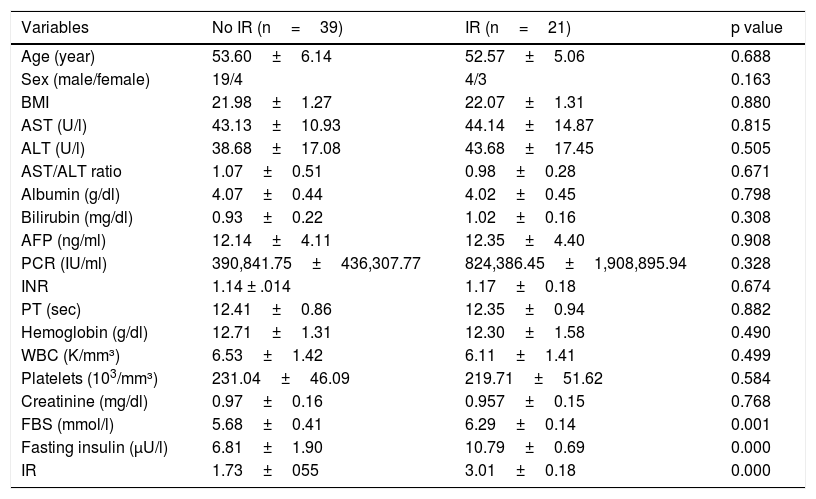
The chronic HCV-infected patients that presented with IR tended to have high fasting insulin (10.79±0.69 vs. 6.81±1.90) and glucose levels (6.29±0.14 vs. 5.68±0.41). Otherwise, there were no significant differences between patients with and without IR in the demographic or laboratory test data (Table 2).
Comparison between chronic hepatitis C virus-infected patients with and without IR in group 2.
| Variables | No IR (n=39) | IR (n=21) | p value |
|---|---|---|---|
| Age (year) | 53.60±6.14 | 52.57±5.06 | 0.688 |
| Sex (male/female) | 19/4 | 4/3 | 0.163 |
| BMI | 21.98±1.27 | 22.07±1.31 | 0.880 |
| AST (U/l) | 43.13±10.93 | 44.14±14.87 | 0.815 |
| ALT (U/l) | 38.68±17.08 | 43.68±17.45 | 0.505 |
| AST/ALT ratio | 1.07±0.51 | 0.98±0.28 | 0.671 |
| Albumin (g/dl) | 4.07±0.44 | 4.02±0.45 | 0.798 |
| Bilirubin (mg/dl) | 0.93±0.22 | 1.02±0.16 | 0.308 |
| AFP (ng/ml) | 12.14±4.11 | 12.35±4.40 | 0.908 |
| PCR (IU/ml) | 390,841.75±436,307.77 | 824,386.45±1,908,895.94 | 0.328 |
| INR | 1.14 ± .014 | 1.17±0.18 | 0.674 |
| PT (sec) | 12.41±0.86 | 12.35±0.94 | 0.882 |
| Hemoglobin (g/dl) | 12.71±1.31 | 12.30±1.58 | 0.490 |
| WBC (K/mm³) | 6.53±1.42 | 6.11±1.41 | 0.499 |
| Platelets (103/mm³) | 231.04±46.09 | 219.71±51.62 | 0.584 |
| Creatinine (mg/dl) | 0.97±0.16 | 0.957±0.15 | 0.768 |
| FBS (mmol/l) | 5.68±0.41 | 6.29±0.14 | 0.001 |
| Fasting insulin (μU/l) | 6.81±1.90 | 10.79±0.69 | 0.000 |
| IR | 1.73±055 | 3.01±0.18 | 0.000 |
AFP: alpha-fetoprotein; ALT: alanine aminotransferase; AST: aspartate aminotransferase; BMI: body mass index; FBS: fasting blood sugar; INR: international normalized ratio; IR: insulin resistance; PCR: polymerase chain reaction; PT: prothrombin time; WBC: white blood cell count.
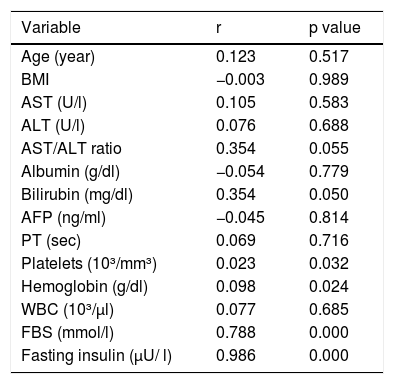
Fasting insulin, fasting glucose, bilirubin, platelets, and hemoglobin levels had significant positive correlations with IR. No other demographic or laboratory test data had a significant correlation with IR (Table 3).
Correlations of the demographic and laboratory test variables with insulin resistance.
| Variable | r | p value |
|---|---|---|
| Age (year) | 0.123 | 0.517 |
| BMI | −0.003 | 0.989 |
| AST (U/l) | 0.105 | 0.583 |
| ALT (U/l) | 0.076 | 0.688 |
| AST/ALT ratio | 0.354 | 0.055 |
| Albumin (g/dl) | −0.054 | 0.779 |
| Bilirubin (mg/dl) | 0.354 | 0.050 |
| AFP (ng/ml) | −0.045 | 0.814 |
| PT (sec) | 0.069 | 0.716 |
| Platelets (10³/mm³) | 0.023 | 0.032 |
| Hemoglobin (g/dl) | 0.098 | 0.024 |
| WBC (10³/μl) | 0.077 | 0.685 |
| FBS (mmol/l) | 0.788 | 0.000 |
| Fasting insulin (μU/ l) | 0.986 | 0.000 |
AFP: alpha-fetoprotein; ALT: alanine aminotransferase; AST: aspartate aminotransferase; BMI: body mass index; FBS: fasting blood sugar; PT: prothrombin time; WBC: white blood cell count.
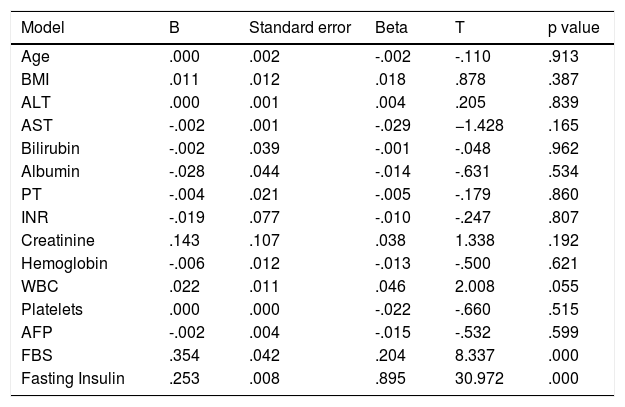
No factors were found to significantly predict IR, except fasting insulin and fasting glucose levels (tables 4 and 5).
Multiple linear regression analysis of factors that affect insulin resistance.
| Model | B | Standard error | Beta | T | p value |
|---|---|---|---|---|---|
| Age | .000 | .002 | -.002 | -.110 | .913 |
| BMI | .011 | .012 | .018 | .878 | .387 |
| ALT | .000 | .001 | .004 | .205 | .839 |
| AST | -.002 | .001 | -.029 | −1.428 | .165 |
| Bilirubin | -.002 | .039 | -.001 | -.048 | .962 |
| Albumin | -.028 | .044 | -.014 | -.631 | .534 |
| PT | -.004 | .021 | -.005 | -.179 | .860 |
| INR | -.019 | .077 | -.010 | -.247 | .807 |
| Creatinine | .143 | .107 | .038 | 1.338 | .192 |
| Hemoglobin | -.006 | .012 | -.013 | -.500 | .621 |
| WBC | .022 | .011 | .046 | 2.008 | .055 |
| Platelets | .000 | .000 | -.022 | -.660 | .515 |
| AFP | -.002 | .004 | -.015 | -.532 | .599 |
| FBS | .354 | .042 | .204 | 8.337 | .000 |
| Fasting Insulin | .253 | .008 | .895 | 30.972 | .000 |
Dependent variable: insulin resistance.
AFP: alpha-fetoprotein; ALT: alanine aminotransferase; AST: aspartate aminotransferase; BMI: body mass index; FBS: fasting blood sugar; INR: international normalized ratio; PT: prothrombin time; WBC: white blood cell count.
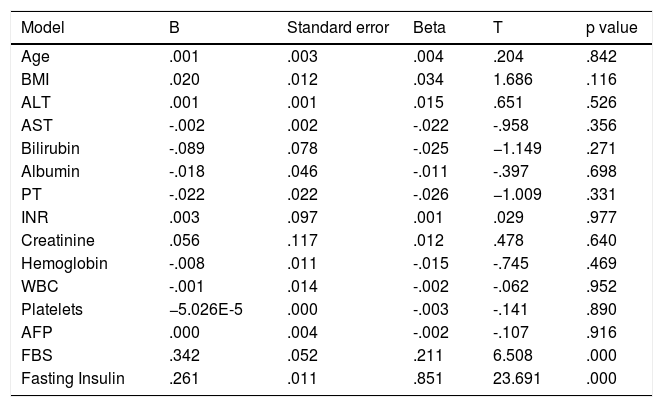
Multiple linear regression analysis of factors affecting IR in group 2.
| Model | B | Standard error | Beta | T | p value |
|---|---|---|---|---|---|
| Age | .001 | .003 | .004 | .204 | .842 |
| BMI | .020 | .012 | .034 | 1.686 | .116 |
| ALT | .001 | .001 | .015 | .651 | .526 |
| AST | -.002 | .002 | -.022 | -.958 | .356 |
| Bilirubin | -.089 | .078 | -.025 | −1.149 | .271 |
| Albumin | -.018 | .046 | -.011 | -.397 | .698 |
| PT | -.022 | .022 | -.026 | −1.009 | .331 |
| INR | .003 | .097 | .001 | .029 | .977 |
| Creatinine | .056 | .117 | .012 | .478 | .640 |
| Hemoglobin | -.008 | .011 | -.015 | -.745 | .469 |
| WBC | -.001 | .014 | -.002 | -.062 | .952 |
| Platelets | −5.026E-5 | .000 | -.003 | -.141 | .890 |
| AFP | .000 | .004 | -.002 | -.107 | .916 |
| FBS | .342 | .052 | .211 | 6.508 | .000 |
| Fasting Insulin | .261 | .011 | .851 | 23.691 | .000 |
AFP: alpha-fetoprotein; ALT: alanine aminotransferase; AST: Aspartate aminotransferase; BMI: body mass index; FBS: fasting blood sugar; INR: international normalized ratio; PT: prothrombin time; WBC: white blood cell count.
IR in HCV-infected patients is higher than in the general population and patients with other chronic liver diseases.8,9 It is associated with progression of liver disease, hepatocellular carcinoma,18–20 and gastric cancer.21,22 Our study aimed to assess the prevalence and determinants of IR in Egyptian nondiabetic chronic HCV-infected patients.
The prevalence of IR in the general population ranges from 10 to 25%,23 whereas it is estimated to vary from 30 to 70% in chronic HCV-infected patients.24,25 The mechanisms for the development of IR in chronic HCV-infected patients are complex. HCV markedly impairs insulin receptor substrate tyrosine phosphorylation and phosphoinositide 3-kinase activation.26 HCV stimulates the production of TNF-α, which activates proteasomal degradation of insulin receptor substrates type 1 and 2, with the subsequent development of IR.10 IR in HCV-infected patients can also be caused by hepatic steatosis.27 In addition, HCV can increase IL-1, IL-6, and leptin levels and decrease adiponectin levels, which can lead to IR.24
In our study, IR (HOMA-IR > 2.7) was found in 23.3% of the group 1 patients versus 46.6% in group 2, with an overall prevalence of 35%. In 2018, Alsebaey et al.28 enrolled 150 Egyptian patients with chronic HCV infection that presented either with chronic disease or with compensated cirrhosis and found IR in 87.3% (the cutoff level in their study was 2). If 2 had been considered the cutoff point in our study, the overall prevalence of IR would have been 71% in groups 2 and 3, collectively. In 2018, El-Sagheer et al.29 included 80 patients with chronic HCV infection and 40 healthy controls, finding IR in 47 (58.75%) patients, utilizing the cutoff point of 3. In 2008, Imazeki et al.30 studied the prevalence of IR in 232 chronic HCV-infected patients and found IR in 54.3% (with a cutoff point of 2). In 2008, Moucari et al.31 evaluated 462 nondiabetic chronic HCV-infected patients and found IR in 32.4% of the patients.
We found statistically significant differences in fasting blood sugar and fasting insulin between the chronic HCV-infected patients with IR and the patients without IR. There were no significant differences between the patients with and without IR in any of the other demographic or laboratory test data. In 2015, Pais et al.14 studied 111 patients with chronic HCV infection and IR (HOMA-IR > 2.7) was demonstrated in 41 (36.9%) patients. Those authors also found that patients with IR had significantly higher BMI, aspartate aminotransferase, and alanine aminotransferase than the patients with no IR.
In the present study, IR correlated only with fasting sugar and fasting insulin. When using the multiple linear regression analysis to assess IR predictors, only fasting blood sugar and fasting insulin were found to significantly predict IR.
Conflicts of interestThe authors declare no conflicts of interest.
FundingNone.
Please cite this article as: Shawky MA, Mohammed AQ, Hassan AM, Ali BH, Moustafa HM. Resistencia a la insulina en pacientes egipcios no diabéticos infectados con el virus de hepatitis C crónica. Revista de Gastroenterología de México. 2020;85:173–179.

