
The controlling nutritional status (CONUT) score has previously been shown to be useful for nutritional assessment and the prediction of several inflammatory and neoplastic diseases. The aim of the present study was to evaluate the potential use of the CONUT score as a method for nutritional screening and predicting severity in ulcerative colitis (UC).
Materials and methodsThe study was conducted on 60 patients diagnosed with UC. Demographic, clinical, and biochemical patient characteristics were collected from their clinical records, and disease severity was assessed using the Truelove and Witts scale (TWS). The risks for malnutrition were evaluated through the nutritional risk index and the CONUT score.
ResultsMore than 90% of the UC patients presented with malnutrition risk, according to the scores analyzed. Patients with a high (>6 points) CONUT score presented with moderate-to-severe activity on the TWS. A higher CONUT score was also associated with an increase in C-reactive protein (CRP) (P=.002) and erythrocyte sedimentation rate (ESR) (P=.009). The data analysis was performed utilizing the SPSS version 19 program.
ConclusionsThe CONUT score could be a promising tool for evaluating nutritional status in UC patients and predicting UC severity.
La utilidad de la escala de control nutricional (CONUT) como método de cribado nutricional y como herramienta de pronóstico en diversas enfermedades inflamatorias y neoplásicas ha sido demostrada con anterioridad. El objetivo del presente estudio fue evaluar el uso potencial de la escala CONUT como método de cribado nutricional y como predictor de severidad para la colitis ulcerosa crónica idiopática (CUCI).
Material y métodosEl estudio incluyó 60 pacientes diagnosticados de CUCI. Se recolectaron las características demográficas, clínicas y bioquímicas de los pacientes a través de la revisión de sus expedientes clínicos, así como la severidad de la enfermedad evaluada mediante la escala Truelove y Witts (ETW). Se evaluó el riesgo de desnutrición mediante el cálculo del índice de riesgo nutricional y la escala CONUT. El análisis de datos se realizó con el paquete estadístico SPSS versión 19.
ResultadosMás del 90% de los pacientes con CUCI presentaron riesgo de desnutrición en las escalas evaluadas. Los pacientes con puntaje alto (>6 puntos) en la escala CONUT presentaban actividad moderada a severa en la ETW. Asimismo, una puntuación CONUT más alta se asoció con niveles más altos de proteína C reactiva (PCR) (p=0.002) y de velocidad de sedimentación globular (VSG) (p=0.009).
ConclusionesLa escala CONUT podría considerarse una herramienta prometedora para evaluar el estado nutricional de los pacientes con CUCI, así como un predictor potencial de la severidad de la CUCI.
Ulcerative colitis (UC) is a complex, multifactorial condition, affecting part or all of the colonic lining. It is often accompanied by bloody stools, which is a common symptom for detection of the disease.1 Incidence is 12 people per 1000 inhabitants in developed nations, and it is more prevalent than Crohn's disease (CD), with which it shares pathophysiologic characteristics. In Mexico, a nationwide cohort study over a period of more than 15 years (2000–2017), in which the authors included a total of 2645 patients with inflammatory bowel disease (IBD), the crude incidence rates of IBD, UC, and CD, respectively, were 0.21, 0.16, and 0.04 cases per 100,000 person-years. The incidence of new cases of IBD has increased significantly over the past 16 years: 5.9-fold for IBD, 5.3-fold for UC, and 9.5-fold for CD. The prevalence rates of IBD, UC, and CD, respectively, were 1.83, 1.45, and 0.34 cases per 100,000 person-years, demonstrating a significant increase of prevalence and incidence of IBD in Mexico in the last 15 years.2
While the causes of this disease are not clear, there is evidence that a genetic-family history and dietary patterns are associated with the risk of developing the condition.3 A number of pathologies that can lead to thrombotic events in a large number of patients are associated with UC, including colorectal cancer,4–6 reduced bone density,7–9 effects on the circulatory system, and coagulation anomalies.10
Consequences of malnutrition in UC are multiple and include major reductions in bone mineral density, prolonged duration of disease activity, and shortened duration of clinical remission.
Although records of body measurements have enabled the correlation of disease severity with overweight-related problems, they are not enough for total disease follow-up.11 On the other hand, the use of noninvasive predictive follow-up methods, such as stool analyses, especially those involving elastase or calprotectin as fecal markers, is one of the challenges associated with studying this pathology. Their use has brought about great advances in disease follow-up, but it is still insufficient for a holistic approach to the disease.12
Serum antibodies and some inflammatory markers are useful for the assessment and clinical follow-up of patients. However, C-reactive protein (CRP) and erythrocyte sedimentation rate (ESR) levels are nonspecific and often not associated with any clinical characteristics, making it necessary to complement measurements with other parameters that can provide more accurate follow-up and opportune treatment of the disease, before complications ensue.13–15
The controlling nutritional status (CONUT) score is based on albumin and total cholesterol levels and the absolute lymphocyte count, to provide sensitivity and specificity in the detection of malnutrition.16 This scale has been used as a predictor of severity and mortality in a number of pathologies, especially heart conditions and gastrointestinal tumors.17–21
Nevertheless, there are no reports on the use of the CONUT scale as a follow-up marker for UC. Thus, the purpose of the present study was to determine the usefulness of the CONUT score as a method for nutritional screening and predicting severity in UC.
Materials and methodsStudy populationWe conducted a cross-sectional study on 60 patients diagnosed with UC that were seen at our institution's Coloproctology Service, from November 2016 to October 2017. All patients were adult men and women, 18 years of age or older, that presented with histologically confirmed UC.
Clinical data collectionClinical records were reviewed to collect the demographic, clinical, and biochemical characteristics of each patient: age, sex, age at diagnosis, disease extension, extraintestinal manifestations (EIMs), clinical course, medical treatment, need for surgical treatment, and serum albumin, cholesterol, potassium, CRP, and ESR levels.
The clinical course of the disease was defined as active that became inactive (first episode followed by a long-term remission of over 5 years), intermittent (fewer than 2 relapses per year), or chronic (persistent activity despite medical treatment). Disease severity was measured using the Truelove and Witts Scale (TWS), Mayo endoscopic scale, and Riley histologic index. Patients were placed in inactive, mild, moderate, or severe activity level groups, according to the criteria set by the evaluation scale.
The risk of malnutrition was assessed using the CONUT score (low risk: 0–4 points; moderate risk: 5–8 points; or high risk: 9–12 points) and the nutritional risk index (NRI), with the following formula: NRI=1.519×serum albumin (g/l)+41.7×(real body weight [kg]/ideal body weight [kg]). Patients were further classified by nutritional risk, as severe (NRI<83.5), moderate (NRI 83.5–97.4), mild (NRI 97.5–99), or no nutritional risk (NRI ≥100). The body mass index (BMI) was also calculated for each patient.
Patients presenting with other types of IBD, such as CD, indeterminate colitis, infectious colitis, or microscopic colitis, were excluded, as were patients with autoimmune disease or UC diagnosis not confirmed by histopathology, or those with incomplete clinical data.
The present study was approved by the Research Ethics Committee of our institution and adheres to the international research treaties and official regulations in force in Mexico.
Statistical analysisThe statistical analysis was carried out using the SPSS version 19 program and the variables were expressed as frequencies, means, and standard deviations. The distribution of the variables was determined by the Kolmogorov–Smirnov test. We used the chi-square test to compare the categorical variables and the Student's t test to compare the medians of the quantitative variables. Multiple comparisons were made utilizing the ANOVA and Kruskal–Wallis tests, when appropriate. An ROC curve was used to obtain a cutoff point for the CONUT score. Using contingency tables, odds ratios and predictive values were obtained.
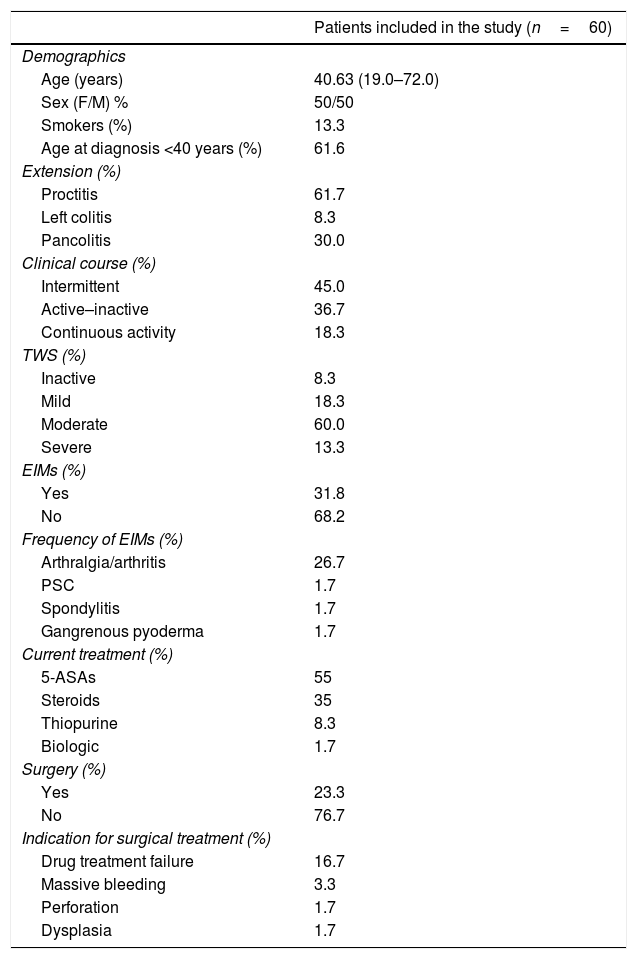
ResultsDescription of the population and clinical dataSixty patients were included in the study. Their mean age was 40.6 years, sex distribution was balanced (50% men and 50% women), and 13.3% of the patients were smokers. Interestingly, 60.6% of the patients were diagnosed with UC before they reached 40 years of age. UC diagnosis before that age was associated with more severe disease, which was shown to be consistent with the type of inflammation seen in the study patients: proctitis was the predominant type (61.7%), followed by pancolitis (30%), and left colitis was found in only 8.3%. A large number of patients had an intermittent clinical course (45%), followed by the active-inactive presentation (36.7%). The smallest group (18.3%) had continuous activity.
In terms of the TWS severity scale, 60% of cases were classified as moderately severe, and inactive disease was the lowest reported percentage (8.3%). EIMs were also recorded in a little over 30% of patients, with arthralgia/arthritis being the most common (26.7%).
The most commonly used treatments for UC were 5-ASAs (55%), whereas only 1.7% of patients received biologic treatment (infliximab). Less than one-fourth of our patients (23.3%) required surgery and it was indicated due to lack of pharmacologic treatment efficacy in 16.7% of them (Table 1). Cytomegalovirus and Clostridium difficile were ruled out in patients that underwent emergency colectomy. Notably, cyclosporine or biologic drugs were not used in UC patients before colectomy because biologics are not available at our institution and most patients cannot afford treatments with biologic agents or cyclosporine due to their socioeconomic status.
Clinical and demographic characteristics of the UC patients.
| Patients included in the study (n=60) | |
|---|---|
| Demographics | |
| Age (years) | 40.63 (19.0–72.0) |
| Sex (F/M) % | 50/50 |
| Smokers (%) | 13.3 |
| Age at diagnosis <40 years (%) | 61.6 |
| Extension (%) | |
| Proctitis | 61.7 |
| Left colitis | 8.3 |
| Pancolitis | 30.0 |
| Clinical course (%) | |
| Intermittent | 45.0 |
| Active–inactive | 36.7 |
| Continuous activity | 18.3 |
| TWS (%) | |
| Inactive | 8.3 |
| Mild | 18.3 |
| Moderate | 60.0 |
| Severe | 13.3 |
| EIMs (%) | |
| Yes | 31.8 |
| No | 68.2 |
| Frequency of EIMs (%) | |
| Arthralgia/arthritis | 26.7 |
| PSC | 1.7 |
| Spondylitis | 1.7 |
| Gangrenous pyoderma | 1.7 |
| Current treatment (%) | |
| 5-ASAs | 55 |
| Steroids | 35 |
| Thiopurine | 8.3 |
| Biologic | 1.7 |
| Surgery (%) | |
| Yes | 23.3 |
| No | 76.7 |
| Indication for surgical treatment (%) | |
| Drug treatment failure | 16.7 |
| Massive bleeding | 3.3 |
| Perforation | 1.7 |
| Dysplasia | 1.7 |
5-ASAs: 5-aminosalicylates; EIMs: extraintestinal manifestations; PSC: primary sclerosing cholangitis; TWS: Truelove and Witts scale.
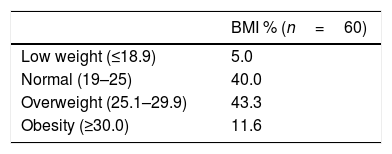
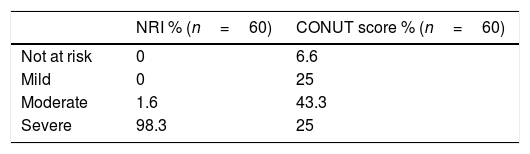
BMI was calculated for all participants. Over 80% were normal or overweight (40% and 43.3%, respectively) and a small proportion (5%) of participants were low weight. According to the NRI, 98.3% of patients were at severe risk of malnutrition. The CONUT score detected 93.3% of patients at risk of malnutrition, 43.3% of whom had moderate risk. It also identified only 6.3% of patients at no risk of malnutrition. Interestingly, percentages found in the severe and mild classifications were similar (25%) (Tables 2 and 3).
For the present analysis, patients were stratified into 2 groups (inactive or mild activity vs. moderate or severe activity) and the median CONUT scores were compared. Patients with higher CONUT scores had moderate-to-severe activity on the TWS, whereas those with lower CONUT scores showed mild or no disease activity with the TWS (6.84±2.86 vs. 4.1±3.02; p=0.009) (Fig. 1). When we compared the CONUT score of patients with UC severity classified by the Mayo endoscopic scale (p=0.35) and the Riley histologic index (p=0.24), there were no statistically significant differences.
 and (B) show the difference in the CONUT score (risk of malnutrition) between UC patients, according to disease severity. Figure (C) shows the difference in the CONUT score between UC patients with inactive or mild disease vs. moderate-to-severe disease.")
Association between the CONUT score and UC severity determined through the TWS. Figures (A) and (B) show the difference in the CONUT score (risk of malnutrition) between UC patients, according to disease severity. Figure (C) shows the difference in the CONUT score between UC patients with inactive or mild disease vs. moderate-to-severe disease.
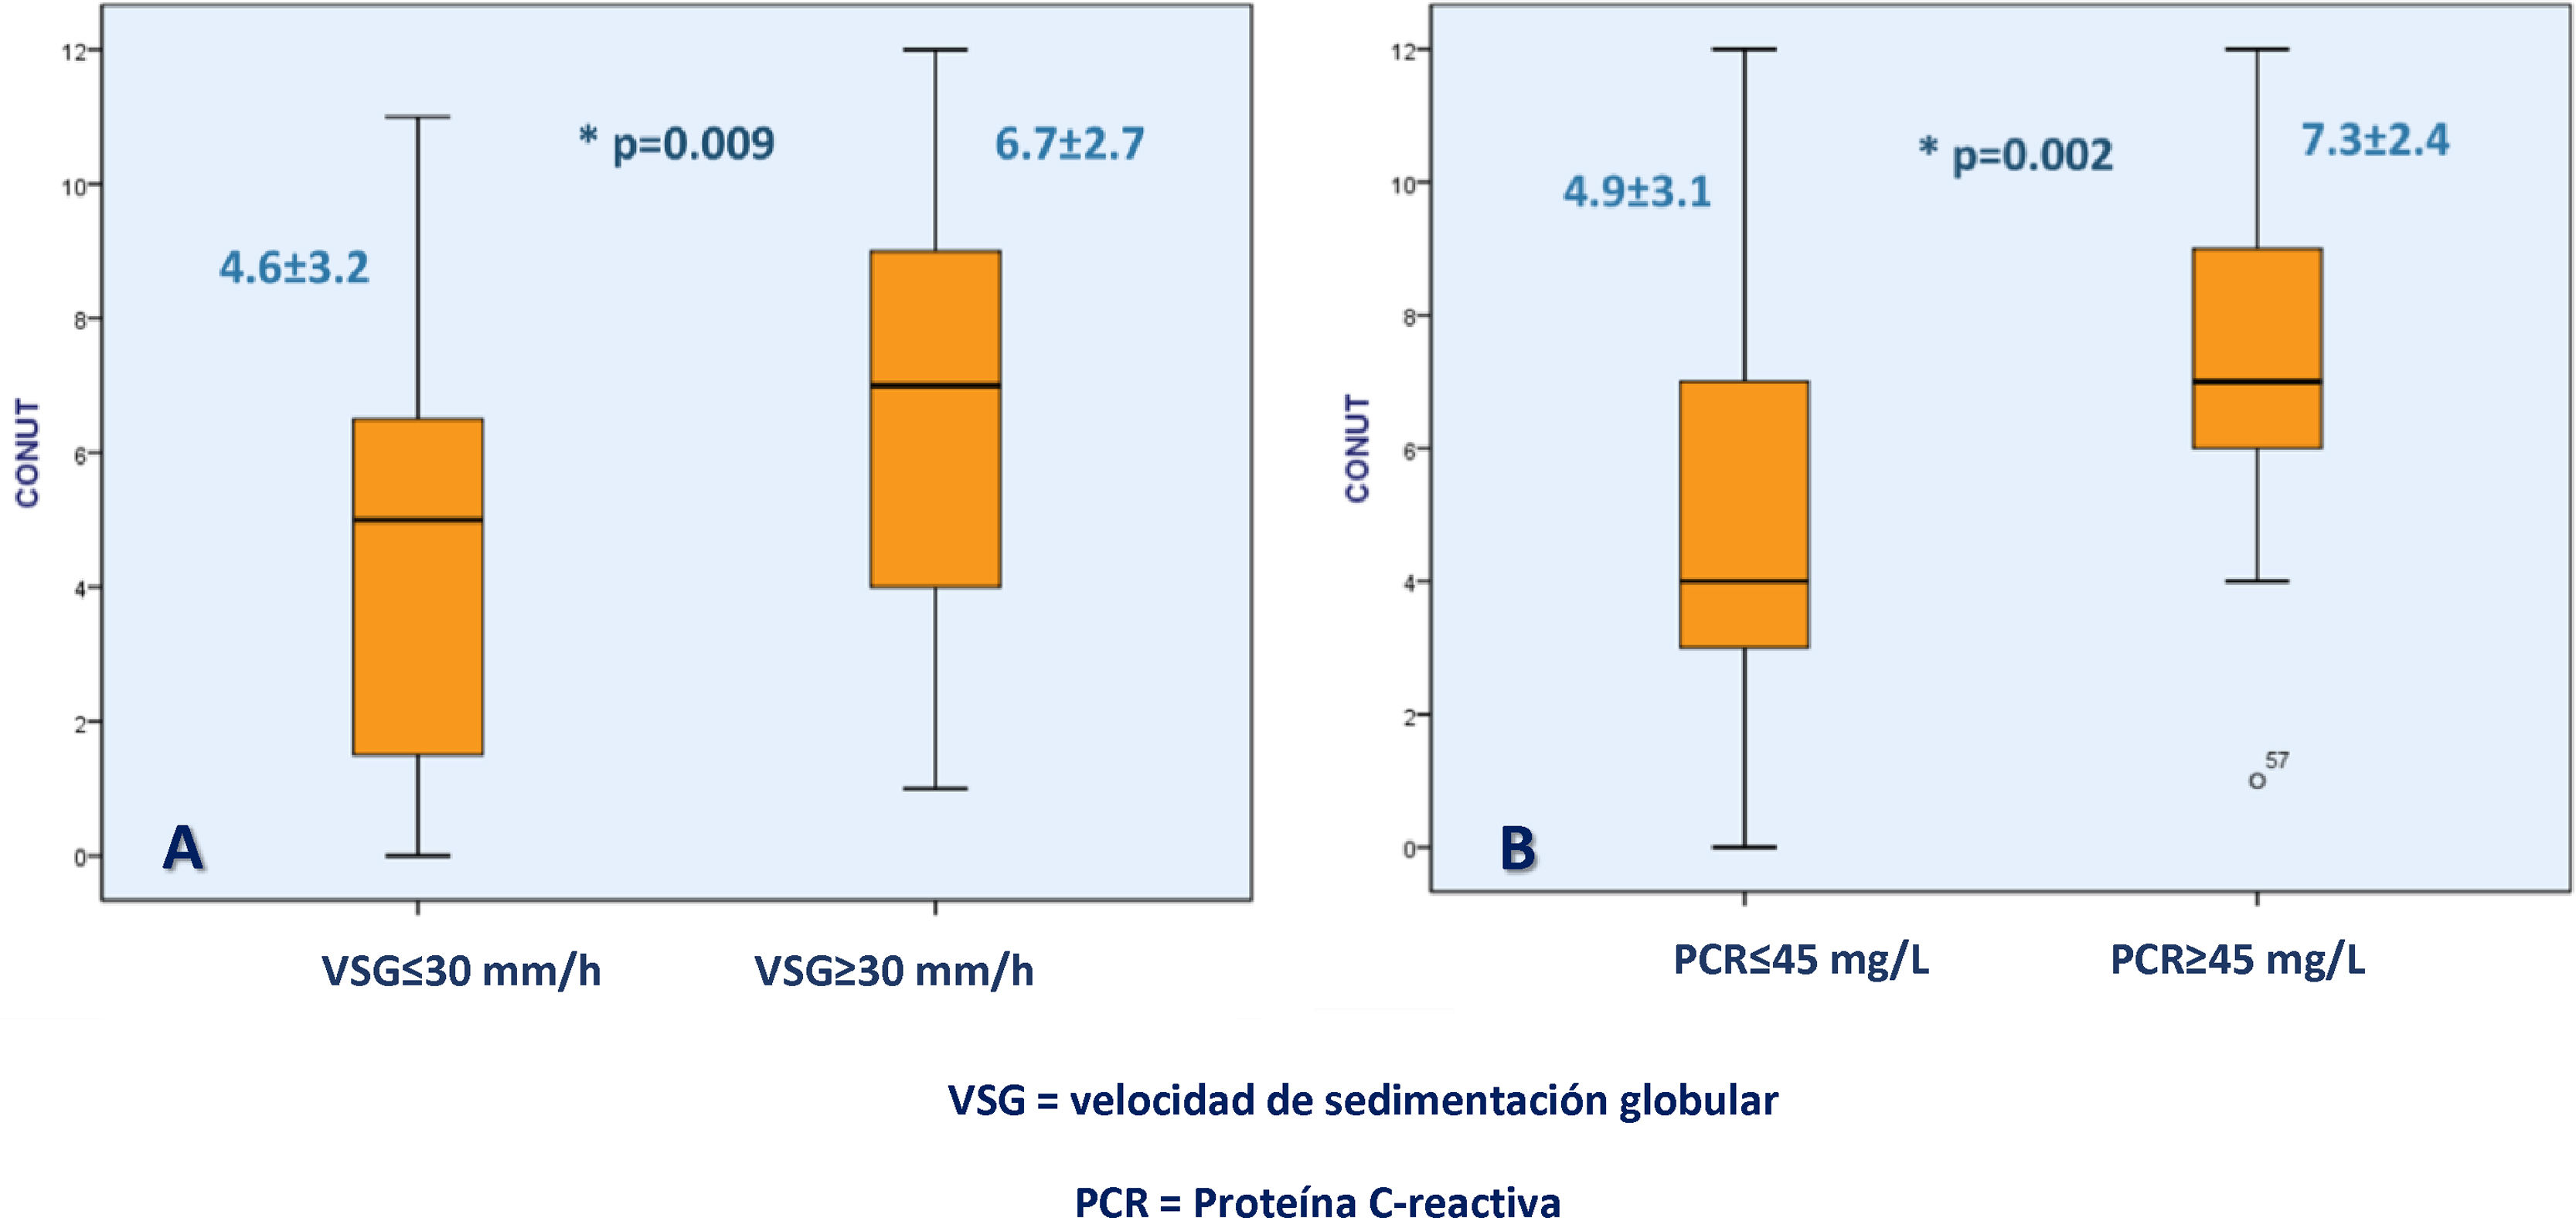
Higher CONUT scores were associated with CRP ≥45mg/dl (7.37±2.45 vs. 4.97±3.19; p=0.002) and ESR ≥30mm/h (6.78±2.78 vs. 4.60±3.26; p=0.009) (Fig. 2).
 shows the difference in the CONUT score between UC patients with an erythrocyte sedimentation rate >30mm/h or <30mm/h and figure (B) shows the difference in the CONUT score between UC patients with C-reactive protein >45mg/l or <45mg/l.")
Association between the CONUT score and biochemical UC severity markers. Figure (A) shows the difference in the CONUT score between UC patients with an erythrocyte sedimentation rate >30mm/h or <30mm/h and figure (B) shows the difference in the CONUT score between UC patients with C-reactive protein >45mg/l or <45mg/l.
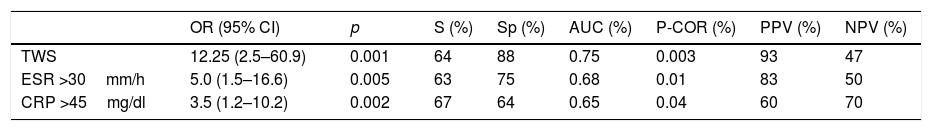
Using an ROC curve, the cutoff point for the CONUT score was ≥6 points. Those scores were associated with higher TWS disease severity scores (AUC=0.75, p=0.003), ESR >30mm/h (AUC=0.68, p=0.01), and CRP >45mg/dl (AUC=0.65, p=0.04). A CONUT score ≥6 points conferred a risk for moderate-to-severe UC determined through the TWS (OR=12.25 [95% CI: 2.5–60.9], p=0.001, sensitivity [S]=64%, specificity [Sp]=88%, positive predictive value [PPV]=83%, negative predictive value [NPV]=50%), ESR >30mm/h (OR=5.0 [95% CI: 1.5–16.6], p=0.005, S=63%, Sp=75%, PPV=83%, NPV=50%) and CRP >45mg/dl (OR=3.5 [95% CI:1.2–10.2], p=0.002, S=67%, Sp=64%, PPV=60%, NPV=70%) (Table 4).
Association between CONUT score and UC clinical and biochemical severity.
| OR (95% CI) | p | S (%) | Sp (%) | AUC (%) | P-COR (%) | PPV (%) | NPV (%) | |
|---|---|---|---|---|---|---|---|---|
| TWS | 12.25 (2.5–60.9) | 0.001 | 64 | 88 | 0.75 | 0.003 | 93 | 47 |
| ESR >30mm/h | 5.0 (1.5–16.6) | 0.005 | 63 | 75 | 0.68 | 0.01 | 83 | 50 |
| CRP >45mg/dl | 3.5 (1.2–10.2) | 0.002 | 67 | 64 | 0.65 | 0.04 | 60 | 70 |
AUC: area under the curve; CI: confidence interval; CRP: C-reactive protein; ESR: erythrocyte sedimentation rate; NPV: negative predictive value; OR: odds-ratio; p: p-value; P-COR: Pearson correlation; PPV: positive predictive value; S: sensitivity; Sp: specificity; TWS: Truelove and Witts scale.
Importantly, when we carried out the analysis of subgroups of our study patients, according to the type of drugs they used for disease control, we found no differences regarding the degree of malnutrition evaluated by the CONUT score (p=0.85), total cholesterol levels (p=0.16), total lymphocyte count (p=0.24), or albumin levels (p=0.74).
Discussion and conclusionOurs is the first study using the CONUT score to assess UC in a Mexican population.
The present study included an equal number of men and women. Clinical data reviewed from the clinical records of UC patients regarding disease activity, severity, and clinical course showed that a large number of them presented with moderate disease severity. The prevalence of UC has increased in recent years, especially in developing countries. At the same time, the UC mortality rate has decreased significantly,22 often due to early detection or better patient follow-up. It is worth mentioning that successful follow-up is achieved in a large number of patients.
The presence or absence of EIMs was one of the parameters considered in our study: a little over 30% of patients had some type of EIM, with a predominance of joint manifestations (26.7%), which is consistent with results reported in other analyses.1
One of the risks for patients with UC is the development of colorectal cancer (CRC), and said risk increases in line with disease extension and duration.23 Recent studies on different populations have shown an increase in the risk for CRC, when UC duration exceeds 8 years,24 as well as a similar risk for CRC development across different populations.25
To monitor disease progression, diagnosis and treatment guidelines and hospital registries recommend periodic monitoring with colonoscopy and histology.26–30 The implementation of colonoscopy monitoring at one-year intervals has helped prevent the development of CRC in UC patients.31,32
However, biopsies and endoscopy/colonoscopy are all invasive methods and uncomfortable for the patient. The use of inflammatory and genetic biomarkers has been proposed for disease diagnosis and follow-up. Nevertheless, the molecules they evaluate are not specific for UC,33–36 and can be found in various conditions with chronic inflammation or infection. To address that issue, the application of a scale has been suggested, to enable the development of an adequate predictive model for a condition as complex as UC.
There are no reports in the literature on malnutrition assessment scales as risk or severity predictors. The CONUT score provides an opportunity to measure malnutrition and monitor progression for a number of diseases, such as colon cancer, and to predict severity in other cases.37–39 There are some reports that have attempted to use pooled predictive measurements, covering a larger number of clinical parameters, but they have not had significant results.2
The TWS, type of inflammation, and disease activity are useful tools for disease follow-up, but they require invasive methods to obtain reliable results. If those assessments correlate with the CONUT score, in terms of severity, said score could become a useful predictive tool for monitoring progression of the disease, as shown in the present investigation.
It is important to analyze the inclusion of the different measurement scales in disease follow-up reflected in the malnutrition domain. The NRI classified more than 90% of our population with severe malnutrition. When the CONUT score was applied, there was a larger number of moderate malnutrition cases, with the upper and lower extremes each making up one-fourth of the population. However, when the CONUT score was correlated with the clinical disease severity endpoints, a significant relation to disease severity was found.
BMI measurements showed that a large part of the population was overweight, most likely reflecting poor eating habits, but when those figures were related to clinical disease parameters, there was no association with either severity or activity of UC. In the literature search, no studies were found that established BMI as a useful surrogate endpoint for disease follow-up or for predicting severity.
It is interesting that, when testing the association of TWS severity and disease activity with the CONUT score, a proportional relation was found, determining that more severe disease resulted in more severe malnutrition. Furthermore, when plotting the ROC curve for the CONUT score cutoff point, an association was also found with ESR >30mm/h (p<0.01), CRP >45mg/dl (p=0.002), and TWS severity. Thus, they can be proposed as a group of acceptable measurements for the prediction of severity in cases of UC.
Calprotectin has been shown to differentiate active IBD from inactive disease. A number of studies have related fecal calprotectin to endoscopically assessed disease activity. In our study, it was not possible to compare fecal calprotectin levels with the CONUT score outcomes.
The present study is limited by its retrospective, uncontrolled design and small sample size. To the best of our knowledge, this is the first study worldwide that demonstrates the utility of the CONUT score as a nutritional screening method and a severity predictor in UC patients. Nevertheless, our findings must be replicated in an independent set of UC patients to confirm the results.
In conclusion, the CONUT score is easy to calculate and provides a useful tool for nutritional screening and predicting clinical/biochemical severity in patients with UC.
Financial disclosureThe authors of this work received financial support from Takeda Mexico related to the publishing process of the manuscript. Takeda Mexico had absolutely no direct or indirect influence on the content of the manuscript, which is the sole responsibility of the authors.
Conflict of interestThe authors declare that they have no conflict of interest.
Please cite this article as: de-León-Rendón JL, López-Pérez RY, Gracida-Mancilla NI, Jiménez-Bobadilla B, Alarcón-Bernés L, Mendoza-Ramírez S, et al. La escala control nutricional (CONUT): una herramienta prometedora para el cribado nutricional y como predictor de severidad en la colitis ulcerosa crónica idiopática. Revista de Gastroenterología de México. 2021;86:110–117.

