In 2013 in Mexico, gastric cancer (GC) was the third leading cause of death from cancer in individuals 20 years of age or older. GC remains a public health problem in Mexico due to its high mortality and low survival rates, and the significantly lower quality of life of patients with this condition.
ObjectivesThe aims of this study were to determine mortality trends nationwide, by state and socioeconomic region, and to determine rates of age-adjusted years of potential life lost due to GC, by state and socioeconomic region, within the period of 2000-2012.
MethodsMortality records associated with GC for 2000-2012 were obtained from the National Health Information System of the Mexican Department of Health. Codes from the Tenth Revision of the International Classification of Diseases corresponding to the basic cause of death from GC were identified. Mortality and age-adjusted years of potential life lost rates, by state and socioeconomic region, were also calculated.
ResultsIn Mexico, 69,107 individuals died from GC within the time frame of 2000-2012. The age-adjusted mortality rate per 100,000 inhabitants decreased from 7.5 to 5.6. The male:female ratio was 1.15:1.0. Chiapas had the highest death rate from GC (9.2, 95% CI 8.2-10.3 [2000] and 8.2, 95% CI 7.3-9 [2012]), as well as regions 1, 2, and 5. Chiapas and socioeconomic region 1 had the highest rate of years of potential life lost.
ConclusionsUsing the world population age distribution as the standard, the age-adjusted mortality rate in Mexico per 100,000 inhabitants that died from GC decreased from 7.5 to 5.6 between 2000 and 2012. Chiapas and socioeconomic regions 1, 2, and 5 had the highest mortality from GC (Chiapas: 9.2, 95% CI 8.2-10.3 [2000] and 8.2, 95% CI 7.3-9 [2012], region 1: 5.5, 95% CI 5.2-5.9 [2000] and 5.3, 95% CI 4.9-5.7 [2012]; region 2: 5.3, 95% CI 5-5.6 [2000] and 5.4, 95% CI 5.1-5.8 [2012]; region 5: 6.1, 95% CI 5.6-6.6 [2000] and 4.6, 95% CI 4.2-5 [2012]). Chiapas and socioeconomic region 1 had the highest rate of years of potential life lost (Chiapas: 97.4 [2000] and 79.6 [2012] and region 1: 73.5 [2000] 65 [2012]).
En México, en el año 2013, el cáncer gástrico ocupó el tercer lugar como causa de muerte en individuos de 20 años o más. El cáncer gástrico permanece como un problema de salud pública en México debido a su alta mortalidad, baja supervivencia y pobre calidad de vida de los pacientes con esta patología.
ObjetivosDeterminar las tendencias de mortalidad por cáncer gástrico a nivel nacional, por estado y región socioeconómica, y las tasas de años potenciales de vida perdidos ajustadas por edad por estado y región socioeconómica en el periodo 2000-2012.
MétodosDel Sistema Nacional de Información de la Secretaría de Salud, se obtuvieron los registros de mortalidad por cáncer gástrico en el período 2000-2012. Esta información es generada por el Instituto Nacional de Estadística y Geografía (INEGI). Se identificaron los códigos de la Clasificación Internacional de Enfermedades décima revisión, que corresponden a la causa básica de defunción por cáncer gástrico. Se calcularon las tasas de mortalidad a nivel nacional, por entidad federativa y por región socioeconómica, también se calcularon las tasas de años potenciales de vida perdidos ajustados por edad, por entidad federativa y región socioeconómica.
ResultadosEn México, durante 2000-2012, murieron 69,107 individuos por cáncer gástrico. La tasa de mortalidad por 100,000 habitantes ajustada con la población mundial se redujo de 7.5 a 5.6. La razón hombre:mujer fue de 1.15:1.0. Chiapas presentó la mayor tasa de mortalidad por cáncer gástrico (9.2, IC del 95%, 8.2-10.3 [2000] y 8.2, CIC del 95%, 7.3-9 [2012]) y las regiones 1, 2 y 5. Chiapas y la región socioeconómica 1 presentaron la mayor tasa de años potenciales de vida perdidos.
ConclusionesEn México, las tasas de mortalidad por cáncer gástrico ajustadas por edad disminuyeron de 7.5 a 5.6 por 100,000 habitantes entre los años 2000 y 2012, tomando como estándar la distribución de edades de la población mundial. Chiapas y las regiones 1, 2 y 5 presentaron la mayor mortalidad por cáncer gástrico (Chiapas: 9.2, IC del 95%, 8.2-10.3 [2000] y 8.2, IC del 95%, 7.3-9 [2012], región 1: 5.5, IC del 95%, 5.2-5.9 [2000] y 5.3, IC del 95%, 4.9-5.7 [2012]; región 2: 5.3, IC del 95%, 5-5.6 [2000] y 5.4, IC del 95%, 5.1-5.8 [2012]; región 5: 6.1, IC del 95%, 5.6-6.6 [2000] y 4.6, IC del 95%, 4.2-5 [2012]). Chiapas y la región socioeconómica 1 tuvieron la mayor tasa de años potenciales de vida perdidos (Chiapas: 97.4 [2000] y 79.6 [2012] y la región 1: 73.5 [2000] y 65 [2012]).
Gastric cancer (GC) remains a public health problem worldwide, despite its significantly decreased incidence and mortality over the past several decades.1
In 1975, GC was the leading cause of cancer in the world and in 2012 it ranked as the fifth leading cause of cancer after lung, breast, colon, and prostate cancers. In 2012, 952,000 new cases of GC were estimated, corresponding to 6.8% of all cancers worldwide. Seventy percent of cases of GC (677,000), 456,000 in men and 221,000 in women, were present in developing countries. Half of all cases worldwide occurred in East Asia, mainly in China. The standardized incidence rates for GC are almost 2 times higher in men than in women. Incidence rates for this disease for men range from 3.3 in West Africa to 35.4 in East Asia and incidence rates for women range from 2.6 in West Africa to 13.8 in East Asia. GC is the third leading cause of death in both sexes in the world (723,000 deaths, 8.8% of the total). The highest rates of mortality are in East Asia (24 per 100,000 in men, 9.8 per 100,000 in women) and the lowest rates are in North America (2.8 and 1.5%, respectively). The highest mortality rates from GC are also present in both sexes in Eastern and Central Europe and in Central and South America.2
In Latin America a decrease in mortality from GC, as in the rest of the world, has also been documented. The Latin American countries with the highest mortality rate in men per 100,000 inhabitants in 2005-2009 were Chile and Costa Rica, with 23.09 and 17.22 per 100,000, respectively, whereas those with the lowest mortality in men in the same period were Cuba and Puerto Rico, with a mortality rate of 5.93 and 4.73, respectively. Latin America countries with the highest mortality from GC in women in 2005-2009 were Ecuador and Colombia, with a mortality rate of 10.53 and 8.55 per 100,000 women, respectively, and those with the lowest mortality were Puerto Rico and Cuba, with a mortality rate of 2.38 and 3.06, respectively.3
In Mexico in 2012, cancer was the third cause of death after heart disease and diabetes mellitus.4 In 2013, GC was the third leading cause of death from cancer in individuals 20 years of age or older. GC remains a public health problem in Mexico due to its high mortality and low survival rates and the significantly lower quality of life of patients with this condition.5 This disease is a major cause of morbidity in men 75 to 79 years old, with a morbidity rate of 47 per 100,000 men, followed by the 65 to 74 year-old population, with a morbidity rate of 38 per 100,000 individuals.5
In Mexico, there are currently no studies investigating mortality trends and rates of years of potential life lost (YPLL) due to GC by state and socioeconomic region and therefore we decided to conduct such an analysis, providing information we consider to be useful, within a study period of 2000-2012.
The aims of this study were to determine mortality trends nationwide and the rates of YPLL due to GC by state and socioeconomic region, within the time frame of 2000-2012.
MethodsA mortality trend study design was employed. Mortality records associated with GC from 2000-2012 were obtained from the National Health Information System of the Mexican Department of Health. This information is generated by the National Institute of Statistics and Geography (INEGI, Spanish acronym)6 and is collected from death certificates issued nationwide. All individual records of mortality in which the basic cause of death was GC in the period 2000-2012 were included in the study. The codes of the International Classification of Diseases, 10th Revision, were identified.7 They corresponded to GC as the basic cause of death (C16-C16.9).
Age-adjusted crude death rates nationwide per 100,000 inhabitants were obtained, utilizing the world population as the population standard.8,9 Age-adjusted mortality rates per 100,000 inhabitants from each state of residence and from each of the seven socioeconomic regions of residence established by the INEGI were also obtained. The national population, estimated by the National Population Council for 2000-2012, was used for rate adjustment.10
The age-adjusted YPLL rates per 100,000 inhabitants were also determined by state of residence and socioeconomic region of residence by the direct method. To calculate the age-adjusted YPLL rates, 5-year age groups were used and the age limits used for the calculation were: lower limit 1 year and upper limit 70 years.11,12 The age-adjusted rates for YPLL were computed by separating the years lost into their respective age groups based on the age of the decedent, and computing the age-specific rates based on the age group populations. These age-specific YPLL rates were then weighted according to the national population and a single rate was calculated.
The calculated age-adjusted rate of YPLL corresponded to the direct method of standardization and was attained by:

Where pi = number of persons of age i in the actual population; pir = number of persons of age i in the reference population; Nr = number of persons between age 1 and 70 in the reference population; di = number of deaths between ages i and i +1; ai = remaining years to live until age 70 when death occurs between ages i and i + 1=70-(i + 0.5).
The 7 socioeconomic regional categories for Mexico were defined by the INEGI according to the XII General Population and Housing Census, presenting the differences observed in the social and economic conditions of the population throughout Mexico. The 7 socioeconomic regions included the 31 states and Mexico City, grouped according to the following indicators related to wellbeing: education, occupation, health, housing, and employment. States with similar characteristics were classified in the same region and each region was different from the other. According to the indicators used, the socioeconomic conditions ranged in ascending order from region 1, the least favorable, to region 7, the most favorable. The aim of the methodology used for establishing the regions was to form strata with a minimal variance, in order to group the most similar elements together following an established likeness criterion, thus enabling one region to be differentiated from another. Among the techniques used were Mahalonobis distances and a combination of factorial analysis and the K-means algorithm.13
Registrations were managed using the Access 2013 program. The Epidat version 3.1 program was used to determine the age-adjusted mortality and YPLL rates.
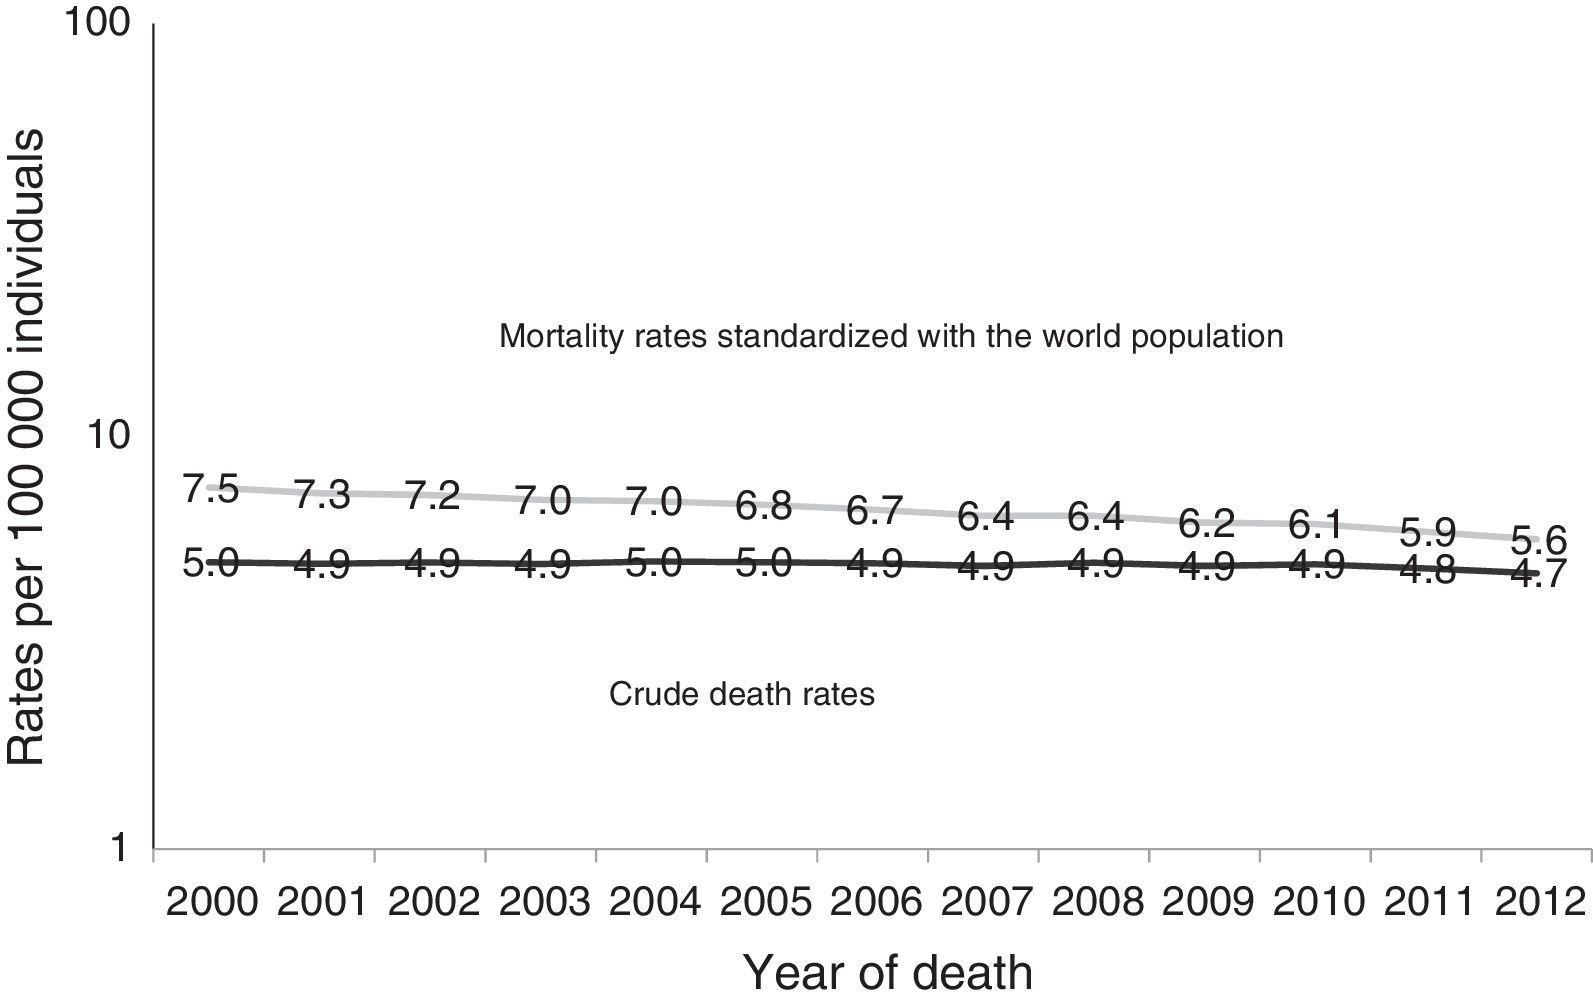
ResultsIn Mexico, a total of 6,679,437 people died during the study period; of those deaths, 827,516 were due to malignant neoplasms, 69,107 of which were GC. In the year 2000, there were 5,003 deaths from GC and in 2012, 5,459 individuals died from this disease. During this period the age-adjusted mortality rate per 100,000 inhabitants that died from GC decreased; in 2000 mortality was 7.5 and in 2012 it was 5.6 (Fig. 1). A greater number of men than women died, with 36,974 cases (53.5%) and 32,133 cases (46.5%), respectively, and a male:female ratio of 1.15:1.0.

Mortality from gastric cancer in Mexico, 2000-2012. Crude death rate per 100,000 individuals. Age-adjusted rate by direct method, standardized with the world population per 100,000 individuals.
Source: Analysis by author from data taken from: The Secretariat of Health, Health in numbers,6 The National Population Council,10 and Ahmad et al.,9.
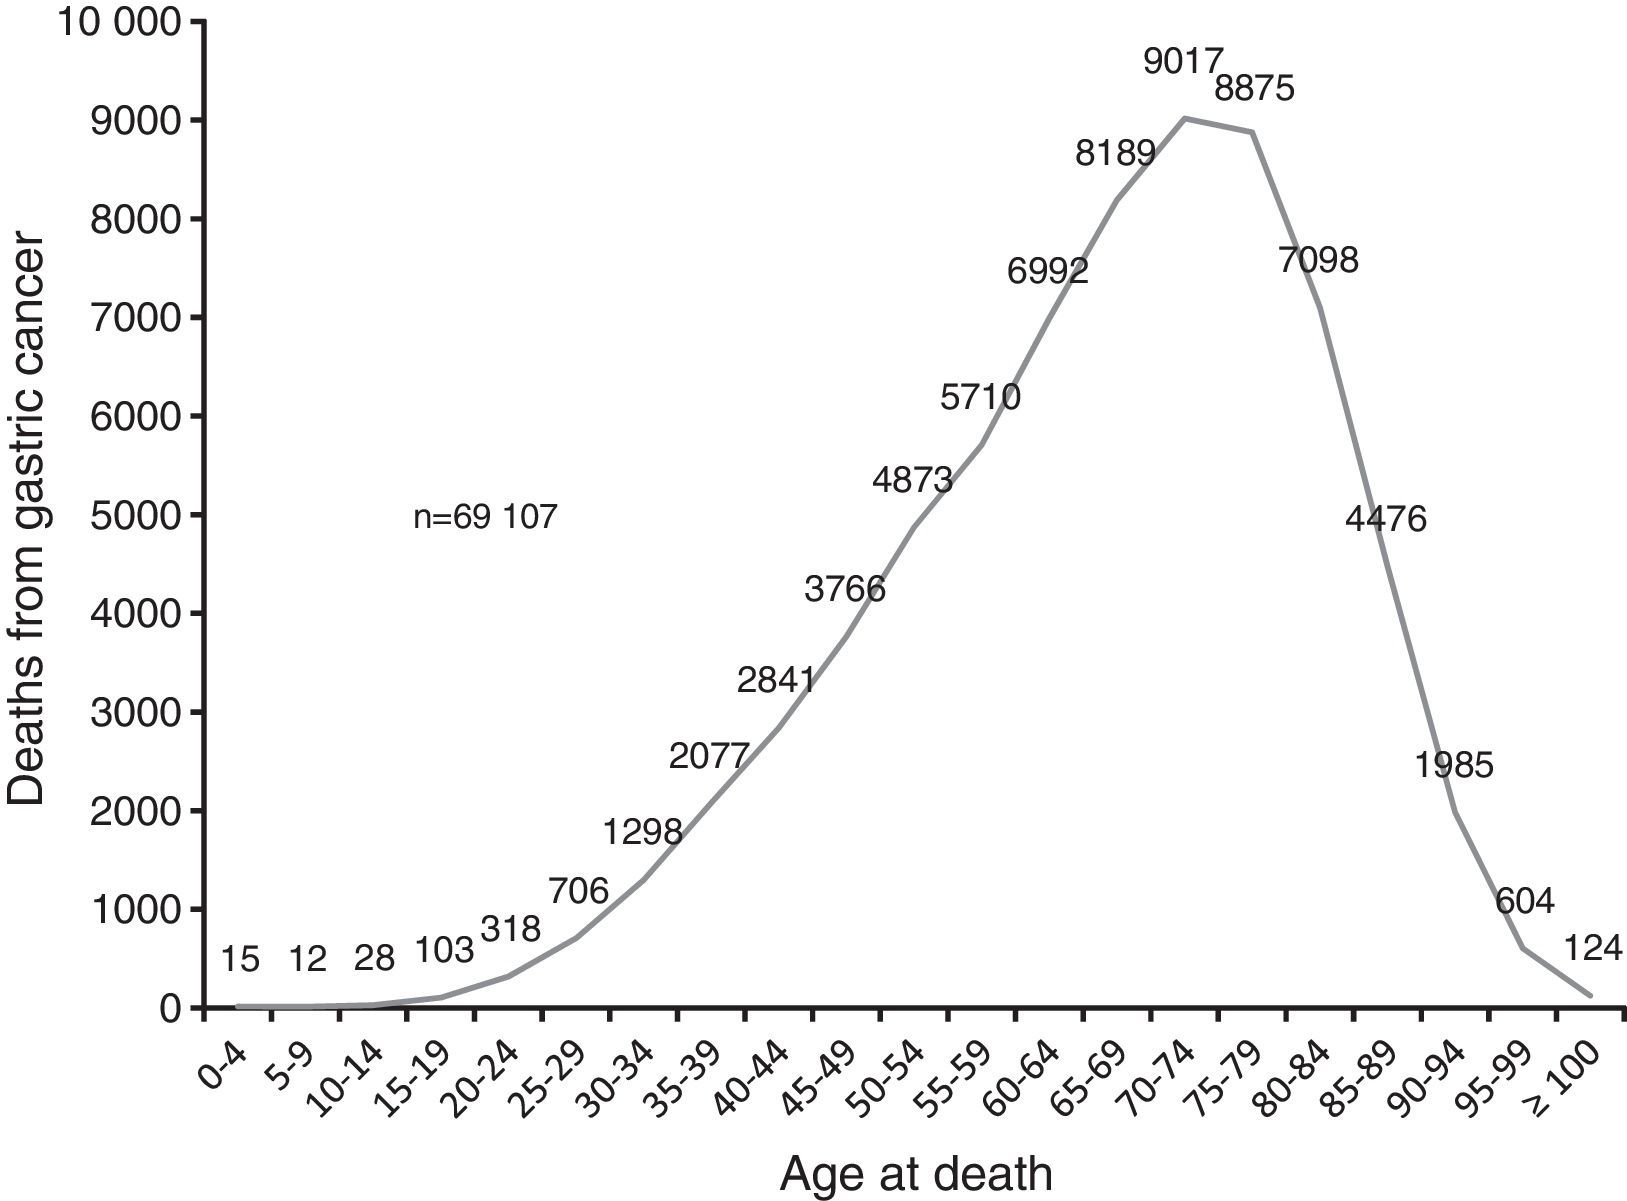
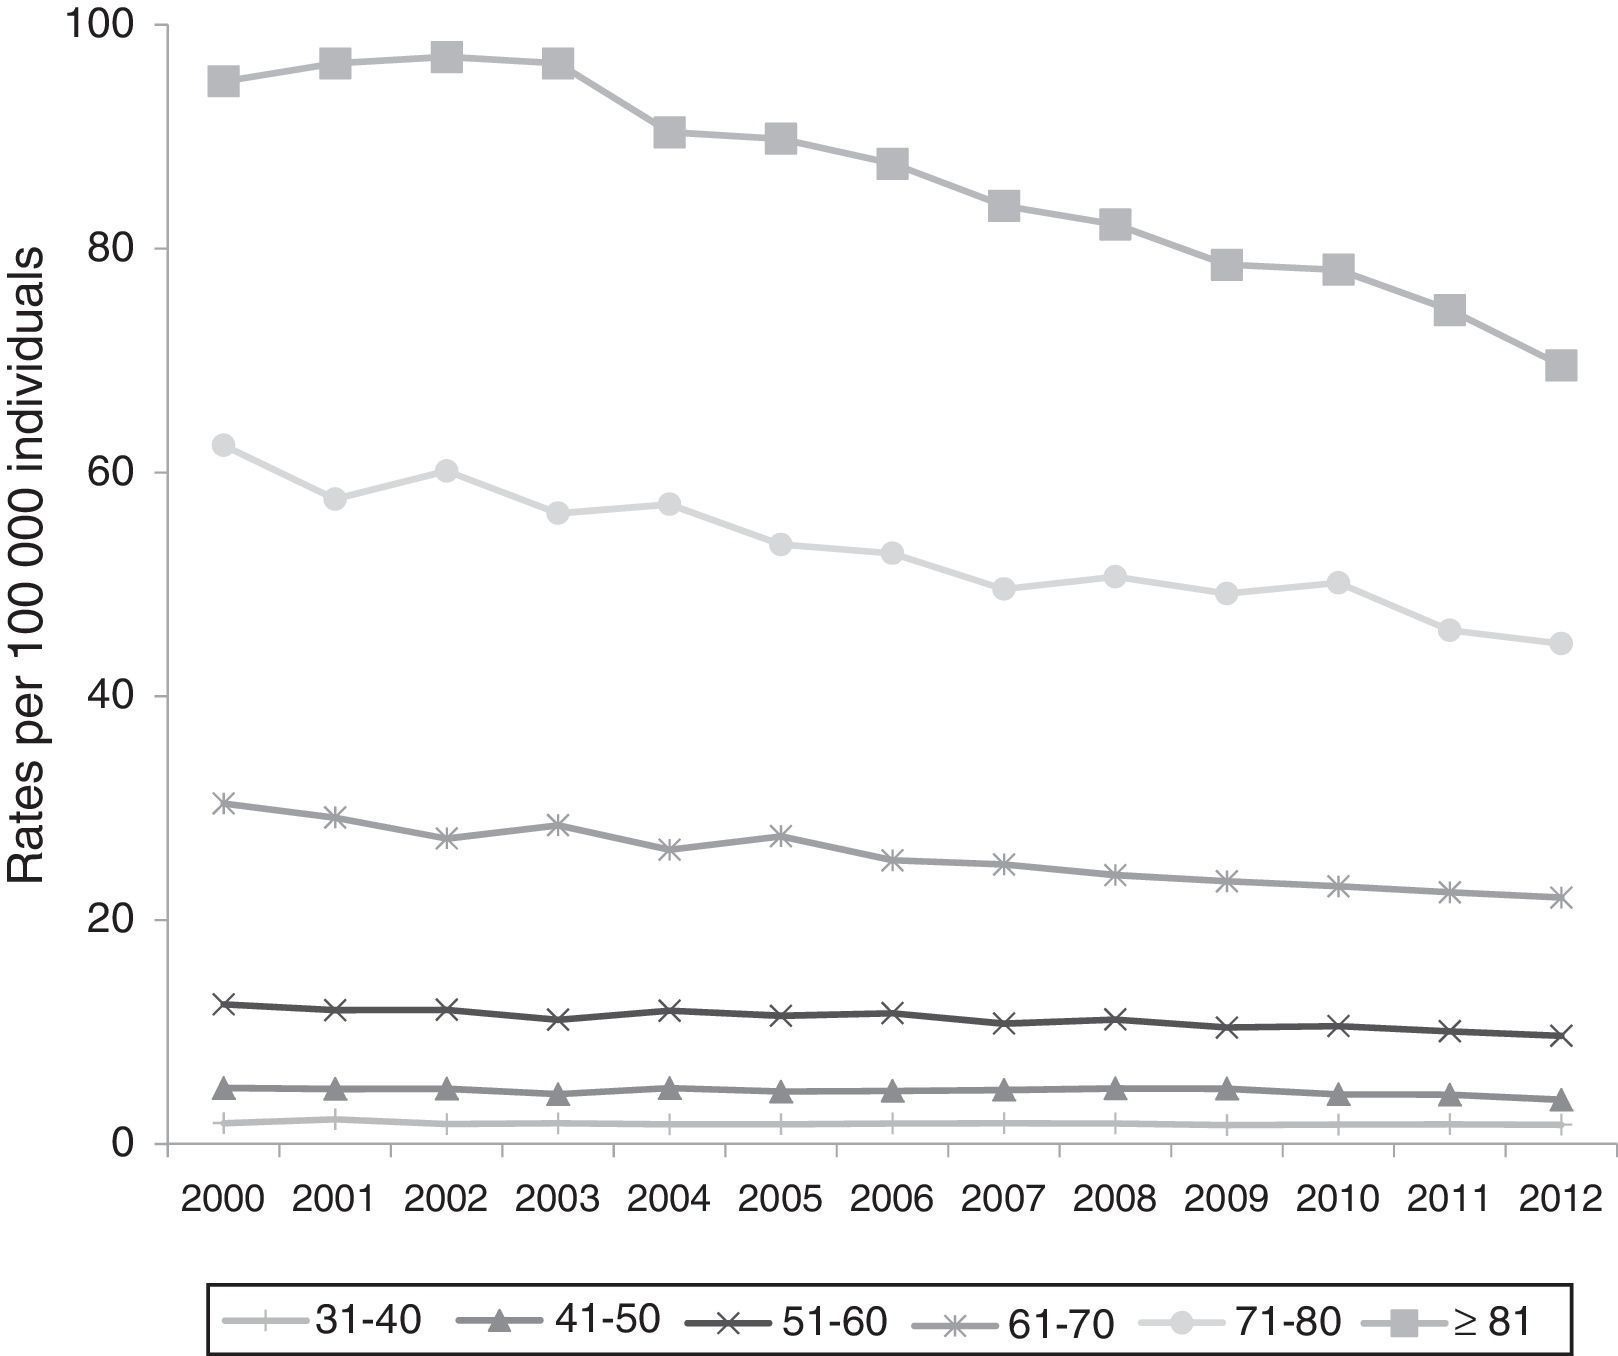
Mortality from GC increased with age in the study population. The highest mortality was in the group of 70 to 74 years with 9,017 cases (13%) (Fig. 2). Trends in mortality rates by age group declined in the study period (Fig. 3).

Mortality from gastric cancer by age. Mexico, 2000-2012.
Source: Analysis by author from data taken from the deceased patient database of the National Health Information System, 1998-20126.

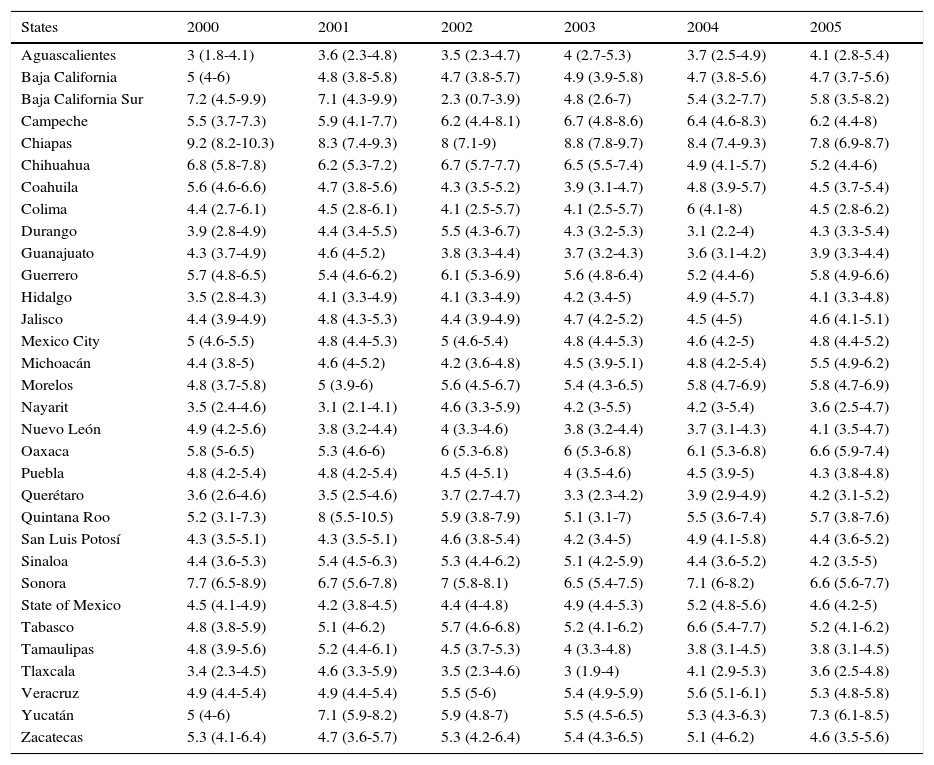
In general, there were downward trends in GC mortality in most states. In the years 2000-2012, Chiapas had the highest rate of death from GC within the 2000-2012 period.
The mortality rate for that pathology in the state of Chiapas was 9.2, 95% CI 8.2-10.3 in 2000 and 8.2, 95% CI 7.3-9 in 2012 (Table 1).
Age-adjusted mortality rate and 95% confidence interval by state of residence of individuals that died from gastric cancer. Mexico, 2000-2012.
| States | 2000 | 2001 | 2002 | 2003 | 2004 | 2005 |
|---|---|---|---|---|---|---|
| Aguascalientes | 3 (1.8-4.1) | 3.6 (2.3-4.8) | 3.5 (2.3-4.7) | 4 (2.7-5.3) | 3.7 (2.5-4.9) | 4.1 (2.8-5.4) |
| Baja California | 5 (4-6) | 4.8 (3.8-5.8) | 4.7 (3.8-5.7) | 4.9 (3.9-5.8) | 4.7 (3.8-5.6) | 4.7 (3.7-5.6) |
| Baja California Sur | 7.2 (4.5-9.9) | 7.1 (4.3-9.9) | 2.3 (0.7-3.9) | 4.8 (2.6-7) | 5.4 (3.2-7.7) | 5.8 (3.5-8.2) |
| Campeche | 5.5 (3.7-7.3) | 5.9 (4.1-7.7) | 6.2 (4.4-8.1) | 6.7 (4.8-8.6) | 6.4 (4.6-8.3) | 6.2 (4.4-8) |
| Chiapas | 9.2 (8.2-10.3) | 8.3 (7.4-9.3) | 8 (7.1-9) | 8.8 (7.8-9.7) | 8.4 (7.4-9.3) | 7.8 (6.9-8.7) |
| Chihuahua | 6.8 (5.8-7.8) | 6.2 (5.3-7.2) | 6.7 (5.7-7.7) | 6.5 (5.5-7.4) | 4.9 (4.1-5.7) | 5.2 (4.4-6) |
| Coahuila | 5.6 (4.6-6.6) | 4.7 (3.8-5.6) | 4.3 (3.5-5.2) | 3.9 (3.1-4.7) | 4.8 (3.9-5.7) | 4.5 (3.7-5.4) |
| Colima | 4.4 (2.7-6.1) | 4.5 (2.8-6.1) | 4.1 (2.5-5.7) | 4.1 (2.5-5.7) | 6 (4.1-8) | 4.5 (2.8-6.2) |
| Durango | 3.9 (2.8-4.9) | 4.4 (3.4-5.5) | 5.5 (4.3-6.7) | 4.3 (3.2-5.3) | 3.1 (2.2-4) | 4.3 (3.3-5.4) |
| Guanajuato | 4.3 (3.7-4.9) | 4.6 (4-5.2) | 3.8 (3.3-4.4) | 3.7 (3.2-4.3) | 3.6 (3.1-4.2) | 3.9 (3.3-4.4) |
| Guerrero | 5.7 (4.8-6.5) | 5.4 (4.6-6.2) | 6.1 (5.3-6.9) | 5.6 (4.8-6.4) | 5.2 (4.4-6) | 5.8 (4.9-6.6) |
| Hidalgo | 3.5 (2.8-4.3) | 4.1 (3.3-4.9) | 4.1 (3.3-4.9) | 4.2 (3.4-5) | 4.9 (4-5.7) | 4.1 (3.3-4.8) |
| Jalisco | 4.4 (3.9-4.9) | 4.8 (4.3-5.3) | 4.4 (3.9-4.9) | 4.7 (4.2-5.2) | 4.5 (4-5) | 4.6 (4.1-5.1) |
| Mexico City | 5 (4.6-5.5) | 4.8 (4.4-5.3) | 5 (4.6-5.4) | 4.8 (4.4-5.3) | 4.6 (4.2-5) | 4.8 (4.4-5.2) |
| Michoacán | 4.4 (3.8-5) | 4.6 (4-5.2) | 4.2 (3.6-4.8) | 4.5 (3.9-5.1) | 4.8 (4.2-5.4) | 5.5 (4.9-6.2) |
| Morelos | 4.8 (3.7-5.8) | 5 (3.9-6) | 5.6 (4.5-6.7) | 5.4 (4.3-6.5) | 5.8 (4.7-6.9) | 5.8 (4.7-6.9) |
| Nayarit | 3.5 (2.4-4.6) | 3.1 (2.1-4.1) | 4.6 (3.3-5.9) | 4.2 (3-5.5) | 4.2 (3-5.4) | 3.6 (2.5-4.7) |
| Nuevo León | 4.9 (4.2-5.6) | 3.8 (3.2-4.4) | 4 (3.3-4.6) | 3.8 (3.2-4.4) | 3.7 (3.1-4.3) | 4.1 (3.5-4.7) |
| Oaxaca | 5.8 (5-6.5) | 5.3 (4.6-6) | 6 (5.3-6.8) | 6 (5.3-6.8) | 6.1 (5.3-6.8) | 6.6 (5.9-7.4) |
| Puebla | 4.8 (4.2-5.4) | 4.8 (4.2-5.4) | 4.5 (4-5.1) | 4 (3.5-4.6) | 4.5 (3.9-5) | 4.3 (3.8-4.8) |
| Querétaro | 3.6 (2.6-4.6) | 3.5 (2.5-4.6) | 3.7 (2.7-4.7) | 3.3 (2.3-4.2) | 3.9 (2.9-4.9) | 4.2 (3.1-5.2) |
| Quintana Roo | 5.2 (3.1-7.3) | 8 (5.5-10.5) | 5.9 (3.8-7.9) | 5.1 (3.1-7) | 5.5 (3.6-7.4) | 5.7 (3.8-7.6) |
| San Luis Potosí | 4.3 (3.5-5.1) | 4.3 (3.5-5.1) | 4.6 (3.8-5.4) | 4.2 (3.4-5) | 4.9 (4.1-5.8) | 4.4 (3.6-5.2) |
| Sinaloa | 4.4 (3.6-5.3) | 5.4 (4.5-6.3) | 5.3 (4.4-6.2) | 5.1 (4.2-5.9) | 4.4 (3.6-5.2) | 4.2 (3.5-5) |
| Sonora | 7.7 (6.5-8.9) | 6.7 (5.6-7.8) | 7 (5.8-8.1) | 6.5 (5.4-7.5) | 7.1 (6-8.2) | 6.6 (5.6-7.7) |
| State of Mexico | 4.5 (4.1-4.9) | 4.2 (3.8-4.5) | 4.4 (4-4.8) | 4.9 (4.4-5.3) | 5.2 (4.8-5.6) | 4.6 (4.2-5) |
| Tabasco | 4.8 (3.8-5.9) | 5.1 (4-6.2) | 5.7 (4.6-6.8) | 5.2 (4.1-6.2) | 6.6 (5.4-7.7) | 5.2 (4.1-6.2) |
| Tamaulipas | 4.8 (3.9-5.6) | 5.2 (4.4-6.1) | 4.5 (3.7-5.3) | 4 (3.3-4.8) | 3.8 (3.1-4.5) | 3.8 (3.1-4.5) |
| Tlaxcala | 3.4 (2.3-4.5) | 4.6 (3.3-5.9) | 3.5 (2.3-4.6) | 3 (1.9-4) | 4.1 (2.9-5.3) | 3.6 (2.5-4.8) |
| Veracruz | 4.9 (4.4-5.4) | 4.9 (4.4-5.4) | 5.5 (5-6) | 5.4 (4.9-5.9) | 5.6 (5.1-6.1) | 5.3 (4.8-5.8) |
| Yucatán | 5 (4-6) | 7.1 (5.9-8.2) | 5.9 (4.8-7) | 5.5 (4.5-6.5) | 5.3 (4.3-6.3) | 7.3 (6.1-8.5) |
| Zacatecas | 5.3 (4.1-6.4) | 4.7 (3.6-5.7) | 5.3 (4.2-6.4) | 5.4 (4.3-6.5) | 5.1 (4-6.2) | 4.6 (3.5-5.6) |
| States | 2006 | 2007 | 2008 | 2009 | 2010 | 2011 | 2012 |
|---|---|---|---|---|---|---|---|
| Aguascalientes | 4.6 (3.2-5.9) | 3.8 (2.6-5) | 3.6 (2.5-4.8) | 3.6 (2.5-4.8) | 3.6 (2.5-4.8) | 3.5 (2.4-4.6) | 3.9 (2.7-5) |
| Baja California | 4 (3.2-4.8) | 4.4 (3.5-5.2) | 4.5 (3.7-5.4) | 4.6 (3.8-5.4) | 4.4 (3.6-5.3) | 3.7 (3-4.4) | 4.5 (3.7-5.3) |
| Baja California Sur | 4.6 (2.5-6.6) | 4.8 (2.7-6.9) | 6.5 (4.2-8.7) | 4.9 (2.9-6.8) | 4.1 (2.3-5.9) | 5.3 (3.3-7.3) | 6.1 (4-8.1) |
| Campeche | 6.2 (4.4-8) | 6.4 (4.6-8.2) | 6.6 (4.8-8.4) | 7.1 (5.2-9) | 7 (5.1-8.8) | 6.1 (4.4-7.8) | 6.6 (4.8-8.4) |
| Chiapas | 8.5 (7.5-9.4) | 9.5 (8.5-10.5) | 9.4 (8.5-10.4) | 9.9 (8.9-10.9) | 8.7 (7.8-9.6) | 8.4 (7.5-9.3) | 8.2 (7.3-9) |
| Chihuahua | 5.4 (4.6-6.2) | 4.6 (3.9-5.4) | 5 (4.2-5.8) | 4.8 (4.1-5.6) | 5.2 (4.4-6) | 4.7 (3.9-5.4) | 4.3 (3.6-5) |
| Coahuila | 5.2 (4.3-6.1) | 4.5 (3.7-5.4) | 3.7 (2.9-4.4) | 3.5 (2.8-4.3) | 3.7 (3-4.5) | 3.3 (2.6-4) | 3.6 (2.9-4.3) |
| Colima | 3.2 (1.8-4.6) | 4.5 (2.9-6.2) | 3.2 (1.9-4.6) | 3.1 (1.8-4.5) | 3.4 (2-4.8) | 3.5 (2.1-4.9) | 4.8 (3.1-6.4) |
| Durango | 3.5 (2.6-4.5) | 4.2 (3.2-5.2) | 4.5 (3.5-5.5) | 4.6 (3.6-5.6) | 3.8 (2.9-4.8) | 3.9 (3-4.9) | 3 (2.2-3.8) |
| Guanajuato | 4.1 (3.6-4.7) | 4.2 (3.7-4.8) | 4 (3.5-4.6) | 3.9 (3.4-4.5) | 4.7 (4.1-5.2) | 4.5 (3.9-5.1) | 4.4 (3.8-4.9) |
| Guerrero | 5 (4.2-5.7) | 5.1 (4.3-5.8) | 6.4 (5.6-7.3) | 6.2 (5.3-7) | 6.2 (5.3-7) | 6.3 (5.5-7.2) | 5.5 (4.7-6.2) |
| Hidalgo | 4.6 (3.8-5.4) | 5 (4.1-5.8) | 3.8 (3.1-4.6) | 4.3 (3.5-5.1) | 5.1 (4.2-5.9) | 4.9 (4.1-5.7) | 4.2 (3.4-4.9) |
| Jalisco | 4.5 (4-5) | 4.5 (4-4.9) | 4.4 (3.9-4.8) | 4.4 (3.9-4.9) | 4.6 (4.1-5.1) | 3.9 (3.5-4.4) | 3.7 (3.3-4.2) |
| Mexico City | 5.1 (4.7-5.5) | 5.1 (4.7-5.5) | 5.1 (4.7-5.5) | 5 (4.6-5.5) | 5.3 (4.8-5.7) | 5.1 (4.7-5.6) | 5 (4.6-5.5) |
| Michoacán | 4.4 (3.8-5) | 4.8 (4.2-5.5) | 4.3 (3.7-4.9) | 4.8 (4.1-5.4) | 4.1 (3.5-4.7) | 4.2 (3.6-4.7) | 4.4 (3.8-5) |
| Morelos | 5.4 (4.4-6.5) | 5.3 (4.3-6.3) | 6 (4.9-7.1) | 4.7 (3.8-5.7) | 5.7 (4.7-6.8) | 5.4 (4.4-6.5) | 5.4 (4.4-6.4) |
| Nayarit | 4 (2.8-5.2) | 4.8 (3.5-6) | 4.2 (3.1-5.4) | 4.3 (3.1-5.5) | 4.5 (3.3-5.7) | 4.6 (3.4-5.8) | 3.5 (2.5-4.6) |
| Nuevo León | 3.6 (3-4.1) | 3.7 (3.1-4.2) | 4 (3.4-4.6) | 3.4 (2.9-4) | 2.9 (2.5-3.4) | 3.3 (2.8-3.8) | 3.3 (2.8-3.8) |
| Oaxaca | 5.9 (5.1-6.6) | 5.2 (4.5-5.8) | 5.5 (4.7-6.2) | 5.7 (5-6.4) | 6.5 (5.7-7.2) | 6.1 (5.3-6.8) | 6 (5.3-6.8) |
| Puebla | 5.2 (4.6-5.8) | 4.4 (3.9-5) | 5.2 (4.6-5.8) | 4.9 (4.3-5.5) | 4.9 (4.3-5.4) | 5.2 (4.6-5.7) | 4.4 (3.9-4.9) |
| Querétaro | 3.4 (2.5-4.4) | 3.9 (2.9-4.9) | 4.2 (3.2-5.3) | 3.8 (2.9-4.8) | 3.3 (2.4-4.2) | 4.4 (3.4-5.4) | 3.7 (2.8-4.7) |
| Quintana Roo | 6.3 (4.4-8.3) | 5.2 (3.4-7) | 3.9 (2.3-5.5) | 5.2 (3.5-6.9) | 6.4 (4.6-8.2) | 5.3 (3.7-7) | 5.7 (4-7.3) |
| San Luis Potosí | 4.6 (3.8-5.4) | 3.6 (2.9-4.3) | 4 (3.3-4.8) | 3.5 (2.8-4.2) | 4 (3.3-4.8) | 3.9 (3.2-4.7) | 3.7 (3-4.3) |
| Sinaloa | 4.8 (4-5.6) | 4.3 (3.5-5) | 4.7 (3.9-5.5) | 4.9 (4.1-5.7) | 4.3 (3.5-5) | 4.4 (3.6-5.1) | 4.1 (3.4-4.8) |
| Sonora | 5.4 (4.5-6.3) | 5.6 (4.7-6.6) | 5.4 (4.5-6.3) | 5.2 (4.3-6.1) | 6.3 (5.3-7.2) | 6.4 (5.4-7.3) | 5.9 (5-6.8) |
| State of Mexico | 4.7 (4.3-5.1) | 4.8 (4.4-5.1) | 4.4 (4-4.8) | 4.5 (4.1-4.8) | 4.8 (4.5-5.2) | 4.4 (4.1-4.8) | 4.4 (4.1-4.8) |
| Tabasco | 5.5 (4.4-6.5) | 4.8 (3.8-5.8) | 5.4 (4.3-6.4) | 5.2 (4.2-6.2) | 5.1 (4.1-6.1) | 5.9 (4.8-6.9) | 4.9 (4-5.9) |
| Tamaulipas | 3.8 (3.1-4.5) | 4.4 (3.6-5.1) | 4.2 (3.5-4.9) | 3.9 (3.2-4.5) | 4 (3.3-4.7) | 3.8 (3.2-4.5) | 3.7 (3-4.3) |
| Tlaxcala | 3.1 (2.1-4.2) | 5.1 (3.7-6.4) | 4.9 (3.6-6.2) | 4 (2.9-5.2) | 4.4 (3.2-5.6) | 4.3 (3.1-5.6) | 4.7 (3.5-6) |
| Veracruz | 5.6 (5.1-6.1) | 5 (4.5-5.4) | 5.4 (4.9-5.9) | 5 (4.6-5.5) | 4.6 (4.1-5) | 4.9 (4.5-5.4) | 5.3 (4.9-5.8) |
| Yucatán | 6.7 (5.6-7.8) | 6.2 (5.1-7.3) | 7.3 (6.1-8.5) | 6.6 (5.5-7.7) | 5.6 (4.6-6.6) | 5.5 (4.6-6.5) | 5.6 (4.7-6.6) |
| Zacatecas | 4.3 (3.3-5.3) | 4 (3-4.9) | 4.7 (3.7-5.8) | 4.6 (3.5-5.6) | 4.2 (3.2-5.2) | 4 (3.1-5) | 3.5 (2.6-4.4) |
Rate per 100,000 inhabitants adjusted by direct method using the national population as the standard population.
Source: Analysis by the author from data taken from the deceased patient database of the National Health Information System, 1998-20126 and the National Population Council: population estimates for the period 1990-2010 and population projections for 2010-2030.10
No one single state had the lowest death rate from GC throughout the period of study. In 2000 Aguascalientes had the lowest mortality from GC with a rate of 3, 95% CI 1.8-4.1; in 2001 Nayarit with 3.1, 95% CI 2.1-4.1; in 2002 Baja California Sur with 2.3, 95% CI 0.7-3.9; in 2003, 2005, and 2006 Tlaxcala with 3, 95% CI 1.9-4, 3.6, 95% CI 2.5-4.8, and 3.1, 95% CI 2.1-4.2, respectively; in 2004 and 2012 Durango with 3.1, 95% CI 2.2-4 and 3, 95% CI 2.2-3.8, respectively; in 2007 San Luis Potosi with 3.6, 95% CI 2.9-4.3; in 2008 and 2009 Colima with 3.2, 95% CI 1.9-4.6 and 3.1 95% CI 1.8-4.5, respectively; in 2010 and 2011 Nuevo Leon with 2.9, 95% CI 2.5-3.4 and 3.3, 95% CI 2.8-3.8, respectively (Table 1).
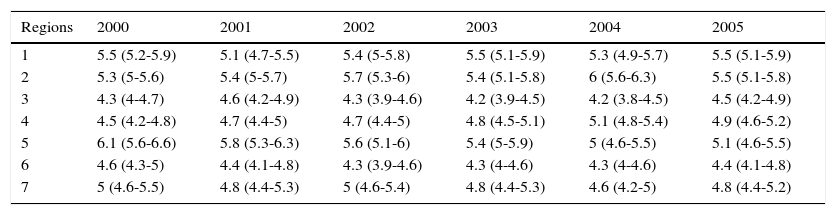
During the study period, there was no one particular region with the highest mortality from GC. Regions 1, 2, and 5 presented with the highest mortality rates (Table 2). In 2000 and 2001, region 5 had the highest mortality from GC with 6.1, 95% CI 5.6-6.6 and 5.8, 95% CI 5.3-6.3, respectively. In 2002, 2004-2008, 2011, and 2012, region 2 had the highest mortality; in 2002 and 2012, the mortality rate in region 2 was 5.7, 95% CI 5.3-6 and 5.4, 95% CI 5.1-5.8, respectively. In the years 2003, 2009, and 2010, region 1 had the highest mortality. In 2003 and 2010 the mortality rate in region 1 was 5.5, 95% CI 5.1-5.9 and 5.7, 95% CI 5.3-6.1, respectively.
Age-adjusted mortality rate and 95% confidence interval by socioeconomic region of individuals that died from gastric cancer. Mexico, 2000-2012.
| Regions | 2000 | 2001 | 2002 | 2003 | 2004 | 2005 |
|---|---|---|---|---|---|---|
| 1 | 5.5 (5.2-5.9) | 5.1 (4.7-5.5) | 5.4 (5-5.8) | 5.5 (5.1-5.9) | 5.3 (4.9-5.7) | 5.5 (5.1-5.9) |
| 2 | 5.3 (5-5.6) | 5.4 (5-5.7) | 5.7 (5.3-6) | 5.4 (5.1-5.8) | 6 (5.6-6.3) | 5.5 (5.1-5.8) |
| 3 | 4.3 (4-4.7) | 4.6 (4.2-4.9) | 4.3 (3.9-4.6) | 4.2 (3.9-4.5) | 4.2 (3.8-4.5) | 4.5 (4.2-4.9) |
| 4 | 4.5 (4.2-4.8) | 4.7 (4.4-5) | 4.7 (4.4-5) | 4.8 (4.5-5.1) | 5.1 (4.8-5.4) | 4.9 (4.6-5.2) |
| 5 | 6.1 (5.6-6.6) | 5.8 (5.3-6.3) | 5.6 (5.1-6) | 5.4 (5-5.9) | 5 (4.6-5.5) | 5.1 (4.6-5.5) |
| 6 | 4.6 (4.3-5) | 4.4 (4.1-4.8) | 4.3 (3.9-4.6) | 4.3 (4-4.6) | 4.3 (4-4.6) | 4.4 (4.1-4.8) |
| 7 | 5 (4.6-5.5) | 4.8 (4.4-5.3) | 5 (4.6-5.4) | 4.8 (4.4-5.3) | 4.6 (4.2-5) | 4.8 (4.4-5.2) |
| Regions | 2006 | 2007 | 2008 | 2009 | 2010 | 2011 | 2012 |
|---|---|---|---|---|---|---|---|
| 1 | 5.2 (4.9-5.6) | 5.3 (4.9-5.7) | 5.7 (5.3-6.1) | 5.8 (5.4-6.2) | 5.7 (5.3-6.1) | 5.6 (5.2-6) | 5.3 (4.9-5.7) |
| 2 | 6 (5.6-6.3) | 5.4 (5-5.7) | 5.7 (5.4-6.1) | 5.5 (5.1-5.8) | 5.4 (5.1-5.8) | 5.7 (5.4-6) | 5.4 (5.1-5.8) |
| 3 | 4.1 (3.8-4.4) | 4.5 (4.1-4.8) | 4.3 (4-4.7) | 4.4 (4-4.7) | 4.3 (4-4.7) | 4.3 (3.9-4.6) | 4.2 (3.8-4.5) |
| 4 | 4.8 (4.6-5.1) | 4.8 (4.5-5.1) | 4.8 (4.5-5) | 4.7 (4.4-5) | 4.8 (4.5-5.1) | 4.6 (4.3-4.9) | 4.5 (4.3-4.8) |
| 5 | 4.7 (4.3-5.1) | 4.7 (4.3-5.1) | 4.8 (4.4-5.2) | 4.6 (4.2-5) | 4.9 (4.5-5.3) | 4.6 (4.3-5) | 4.6 (4.2-5) |
| 6 | 4.4 (4-4.7) | 4.2 (3.9-4.5) | 4.1 (3.8-4.4) | 4 (3.6-4.3) | 3.9 (3.6-4.2) | 3.6 (3.3-3.9) | 3.6 (3.3-3.9) |
| 7 | 5.1 (4.7-5.5) | 5.1 (4.7-5.5) | 5.1 (4.7-5.5) | 5 (4.6-5.5) | 5.3 (4.8-5.7) | 5.1 (4.7-5.6) | 5 (4.6-5.5) |
Rate per 100,000 inhabitants adjusted by direct method using the national population as the standard population.
Source: Analysis by author from data taken from the deceased patient database of the National Health Information System, 1998-20126 and the National Population Council: population estimates for the period 1990-2010 and population projections for 2010-2030.10
Regions with the lowest mortality rates in the study period were regions 3 (in the years 2000, 2003, 2004, 2006) and 6 (in 2001, 2002, 2005, 2007-2012) (Table 2). Mortality rates in region 3 in 2000 and 2006 were 4.3, 95% CI 4-4.7 and 4.1, 95% CI 3.8-4.4, respectively; and in region 6 in 2001 and 2012 the mortality rate was 4.4, 95% CI 4.1-4.8 and 3.6, 95% CI 3.3-3.9, respectively (Table 2).
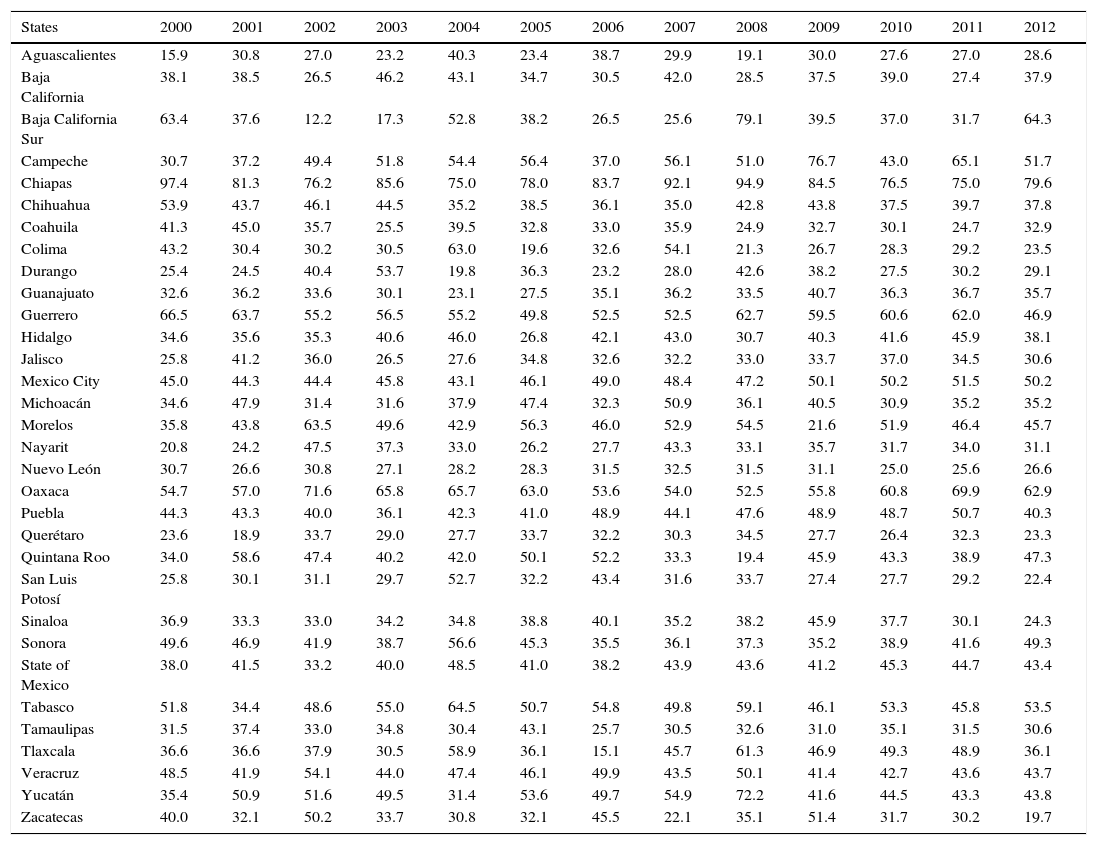
The state with the highest YPLL rate in the study period was Chiapas; in 2000 the rate was 97.4 and in 2012 it was 79.6 (Table 3). The states with the lowest YPLL rates were Aguascalientes in 2000 and 2008 (15.9 and 19.1, respectively), Queretaro in 2001 (18.9), Baja California Sur in 2002 and 2003 (12.2 and 17.3, respectively), Durango in 2004 (19.8), Colima in 2005 (19.6), Tlaxcala in 2006 (15.1), Zacatecas in 2007 and 2012 (22.1 and 19.7, respectively), Morelos in 2009 (21.6), Nuevo León in 2010 (25), and Coahuila in 2011 (24.7) (Table 3).
Age-adjusted rate of years of potential life lost by state of residence of individuals that died from gastric cancer. Mexico, 2000-2012.
| States | 2000 | 2001 | 2002 | 2003 | 2004 | 2005 | 2006 | 2007 | 2008 | 2009 | 2010 | 2011 | 2012 |
|---|---|---|---|---|---|---|---|---|---|---|---|---|---|
| Aguascalientes | 15.9 | 30.8 | 27.0 | 23.2 | 40.3 | 23.4 | 38.7 | 29.9 | 19.1 | 30.0 | 27.6 | 27.0 | 28.6 |
| Baja California | 38.1 | 38.5 | 26.5 | 46.2 | 43.1 | 34.7 | 30.5 | 42.0 | 28.5 | 37.5 | 39.0 | 27.4 | 37.9 |
| Baja California Sur | 63.4 | 37.6 | 12.2 | 17.3 | 52.8 | 38.2 | 26.5 | 25.6 | 79.1 | 39.5 | 37.0 | 31.7 | 64.3 |
| Campeche | 30.7 | 37.2 | 49.4 | 51.8 | 54.4 | 56.4 | 37.0 | 56.1 | 51.0 | 76.7 | 43.0 | 65.1 | 51.7 |
| Chiapas | 97.4 | 81.3 | 76.2 | 85.6 | 75.0 | 78.0 | 83.7 | 92.1 | 94.9 | 84.5 | 76.5 | 75.0 | 79.6 |
| Chihuahua | 53.9 | 43.7 | 46.1 | 44.5 | 35.2 | 38.5 | 36.1 | 35.0 | 42.8 | 43.8 | 37.5 | 39.7 | 37.8 |
| Coahuila | 41.3 | 45.0 | 35.7 | 25.5 | 39.5 | 32.8 | 33.0 | 35.9 | 24.9 | 32.7 | 30.1 | 24.7 | 32.9 |
| Colima | 43.2 | 30.4 | 30.2 | 30.5 | 63.0 | 19.6 | 32.6 | 54.1 | 21.3 | 26.7 | 28.3 | 29.2 | 23.5 |
| Durango | 25.4 | 24.5 | 40.4 | 53.7 | 19.8 | 36.3 | 23.2 | 28.0 | 42.6 | 38.2 | 27.5 | 30.2 | 29.1 |
| Guanajuato | 32.6 | 36.2 | 33.6 | 30.1 | 23.1 | 27.5 | 35.1 | 36.2 | 33.5 | 40.7 | 36.3 | 36.7 | 35.7 |
| Guerrero | 66.5 | 63.7 | 55.2 | 56.5 | 55.2 | 49.8 | 52.5 | 52.5 | 62.7 | 59.5 | 60.6 | 62.0 | 46.9 |
| Hidalgo | 34.6 | 35.6 | 35.3 | 40.6 | 46.0 | 26.8 | 42.1 | 43.0 | 30.7 | 40.3 | 41.6 | 45.9 | 38.1 |
| Jalisco | 25.8 | 41.2 | 36.0 | 26.5 | 27.6 | 34.8 | 32.6 | 32.2 | 33.0 | 33.7 | 37.0 | 34.5 | 30.6 |
| Mexico City | 45.0 | 44.3 | 44.4 | 45.8 | 43.1 | 46.1 | 49.0 | 48.4 | 47.2 | 50.1 | 50.2 | 51.5 | 50.2 |
| Michoacán | 34.6 | 47.9 | 31.4 | 31.6 | 37.9 | 47.4 | 32.3 | 50.9 | 36.1 | 40.5 | 30.9 | 35.2 | 35.2 |
| Morelos | 35.8 | 43.8 | 63.5 | 49.6 | 42.9 | 56.3 | 46.0 | 52.9 | 54.5 | 21.6 | 51.9 | 46.4 | 45.7 |
| Nayarit | 20.8 | 24.2 | 47.5 | 37.3 | 33.0 | 26.2 | 27.7 | 43.3 | 33.1 | 35.7 | 31.7 | 34.0 | 31.1 |
| Nuevo León | 30.7 | 26.6 | 30.8 | 27.1 | 28.2 | 28.3 | 31.5 | 32.5 | 31.5 | 31.1 | 25.0 | 25.6 | 26.6 |
| Oaxaca | 54.7 | 57.0 | 71.6 | 65.8 | 65.7 | 63.0 | 53.6 | 54.0 | 52.5 | 55.8 | 60.8 | 69.9 | 62.9 |
| Puebla | 44.3 | 43.3 | 40.0 | 36.1 | 42.3 | 41.0 | 48.9 | 44.1 | 47.6 | 48.9 | 48.7 | 50.7 | 40.3 |
| Querétaro | 23.6 | 18.9 | 33.7 | 29.0 | 27.7 | 33.7 | 32.2 | 30.3 | 34.5 | 27.7 | 26.4 | 32.3 | 23.3 |
| Quintana Roo | 34.0 | 58.6 | 47.4 | 40.2 | 42.0 | 50.1 | 52.2 | 33.3 | 19.4 | 45.9 | 43.3 | 38.9 | 47.3 |
| San Luis Potosí | 25.8 | 30.1 | 31.1 | 29.7 | 52.7 | 32.2 | 43.4 | 31.6 | 33.7 | 27.4 | 27.7 | 29.2 | 22.4 |
| Sinaloa | 36.9 | 33.3 | 33.0 | 34.2 | 34.8 | 38.8 | 40.1 | 35.2 | 38.2 | 45.9 | 37.7 | 30.1 | 24.3 |
| Sonora | 49.6 | 46.9 | 41.9 | 38.7 | 56.6 | 45.3 | 35.5 | 36.1 | 37.3 | 35.2 | 38.9 | 41.6 | 49.3 |
| State of Mexico | 38.0 | 41.5 | 33.2 | 40.0 | 48.5 | 41.0 | 38.2 | 43.9 | 43.6 | 41.2 | 45.3 | 44.7 | 43.4 |
| Tabasco | 51.8 | 34.4 | 48.6 | 55.0 | 64.5 | 50.7 | 54.8 | 49.8 | 59.1 | 46.1 | 53.3 | 45.8 | 53.5 |
| Tamaulipas | 31.5 | 37.4 | 33.0 | 34.8 | 30.4 | 43.1 | 25.7 | 30.5 | 32.6 | 31.0 | 35.1 | 31.5 | 30.6 |
| Tlaxcala | 36.6 | 36.6 | 37.9 | 30.5 | 58.9 | 36.1 | 15.1 | 45.7 | 61.3 | 46.9 | 49.3 | 48.9 | 36.1 |
| Veracruz | 48.5 | 41.9 | 54.1 | 44.0 | 47.4 | 46.1 | 49.9 | 43.5 | 50.1 | 41.4 | 42.7 | 43.6 | 43.7 |
| Yucatán | 35.4 | 50.9 | 51.6 | 49.5 | 31.4 | 53.6 | 49.7 | 54.9 | 72.2 | 41.6 | 44.5 | 43.3 | 43.8 |
| Zacatecas | 40.0 | 32.1 | 50.2 | 33.7 | 30.8 | 32.1 | 45.5 | 22.1 | 35.1 | 51.4 | 31.7 | 30.2 | 19.7 |
Rate per 100,000 inhabitants adjusted by direct method using the national population as the standard population.
Source: Analysis by the author from data taken from the deceased patient database of the National Health Information System, 1998-20126 and the National Population Council: population estimates for the period 1990-2010 and population projections for 2010-2030.10
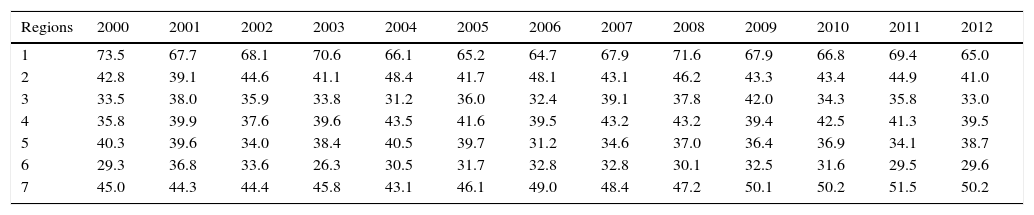
Region 1 had the highest rate of YPLL from GC in the years 2000-2012. In 2000 and 2012 the YPLL rate for region 1 was 73.5 and 65, respectively. Region 6 had the lowest YPLL rate in the study period, except for 2006. In region 6 the YPLL rate in 2000 and 2012 was 29.3 and 29.6, respectively (Table 4).
Age-adjusted rate of years of potential life lost by socioeconomic region of individuals that died from gastric cancer. Mexico, 2000-2012.
| Regions | 2000 | 2001 | 2002 | 2003 | 2004 | 2005 | 2006 | 2007 | 2008 | 2009 | 2010 | 2011 | 2012 |
|---|---|---|---|---|---|---|---|---|---|---|---|---|---|
| 1 | 73.5 | 67.7 | 68.1 | 70.6 | 66.1 | 65.2 | 64.7 | 67.9 | 71.6 | 67.9 | 66.8 | 69.4 | 65.0 |
| 2 | 42.8 | 39.1 | 44.6 | 41.1 | 48.4 | 41.7 | 48.1 | 43.1 | 46.2 | 43.3 | 43.4 | 44.9 | 41.0 |
| 3 | 33.5 | 38.0 | 35.9 | 33.8 | 31.2 | 36.0 | 32.4 | 39.1 | 37.8 | 42.0 | 34.3 | 35.8 | 33.0 |
| 4 | 35.8 | 39.9 | 37.6 | 39.6 | 43.5 | 41.6 | 39.5 | 43.2 | 43.2 | 39.4 | 42.5 | 41.3 | 39.5 |
| 5 | 40.3 | 39.6 | 34.0 | 38.4 | 40.5 | 39.7 | 31.2 | 34.6 | 37.0 | 36.4 | 36.9 | 34.1 | 38.7 |
| 6 | 29.3 | 36.8 | 33.6 | 26.3 | 30.5 | 31.7 | 32.8 | 32.8 | 30.1 | 32.5 | 31.6 | 29.5 | 29.6 |
| 7 | 45.0 | 44.3 | 44.4 | 45.8 | 43.1 | 46.1 | 49.0 | 48.4 | 47.2 | 50.1 | 50.2 | 51.5 | 50.2 |
Rate per 100,000 inhabitants adjusted by direct method using the national population as the standard population.
Source: Analysis by the author from data taken from the deceased patient database of the National Health Information System, 1998-20126 and the National Population Council: population estimates for the period 1990-2010 and population projections for 2010-2030.10
In Mexico, GC mortality rates have remained relatively stable over the past 40 years.5 Nevertheless, in this work a slight decrease in mortality was found in the period 2000-2012 (Fig. 1). In 2000 the age-adjusted mortality rate per 100,000 inhabitants was 7.5 and in 2012 it was 5.6, whereas the general mortality from GC worldwide has decreased significantly over the last decades. This decrease has mainly been attributed to the decrease in Helicobacter pylori (H. pylori) infection, smoking reduction, and improvement in food preservation and diet. However, the patterns in GC trends vary substantially among geographic regions, reflecting the heterogeneous distribution of exposure to the main risk factors associated with GC among populations, age groups, and birth cohorts at different periods of time.3 Another explanation suggests that the worldwide decrease in mortality from GC could be due to the fact that other cancers have become relatively more important than GC, such as lung, prostate, and breast cancers.14
In this study a predominance of mortality in men was identified, with 36,974 cases (53.5%), whereas in women there were 32,133 cases (46.5%) and a male:female ratio of 1.15:1.0. In other studies performed in Mexico, a sex ratio similar to that identified in this work has also been reported. From a 1980-1997 time frame, Tovar-Guzman et al.15 reported a male:female ratio of 1.2:1.0. In other international studies the sex ratio was higher. Forman et al.14 found that in most developed countries the sex ratio was 1.54:1.0, in the least developed ones it was 1.85:1.0, and it was 1.75:1.0 worldwide.
This study identified an increase in mortality from GC related to the age of the study population (figs. 2 and 3). Cancer is generally a disease of aging,16 since a correlation between the incidence of cancer and age has been observed in most cancers, suggesting that the phenomena of aging and cancer are intricately related. Evidence suggests that age and chronic inflammation are associated with an increased risk for GC. H. pylori infection systematically causes chronic gastric inflammation and is one of the major factors contributing to the development of GC.17 It has been shown that infection by H. pylori increases with age. In Mexico there has been a high prevalence of infection by H. pylori. In the age group from 5 to 9 years, a prevalence of 43% has been found, whereas in adults it ranges from 70 to 90%.18 Camargo et al.19 found a relationship between the seroprevalence of H. pylori and age; the probability of infection by H. pylori increased with each year of age (odds ratio, 1.10; 95% CI 1.08-1.13).
Chiapas had the highest mortality from GC in Mexico within the study period (Table 1). Other studies have also reported that Chiapas is one of the states with the highest mortality from GC in Mexico.15H. pylori infection has been detected in this state in 69.5% of the population and a high percentage of cases are related to precursor GC lesions. Mohar et al.20 found that patients in Chiapas presenting with H. pylori had chronic atrophic gastritis (59%), intestinal metaplasia (51%), and dysplasia (13%). Torres et al.21 reported that Chiapas is one of the states with the highest mortality rate in Mexico (6.4 per 100,000 individuals in 1991) and also identified a 63.4% prevalence of H. pylori infection with CagA-positive strains (these seroprevalence values are taken from the 1987-1988 national survey).
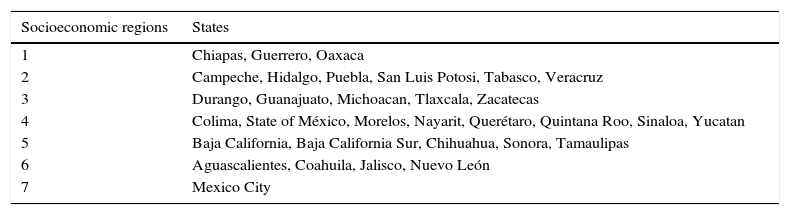
Regions 1, 2, and 5 had the highest death rate from GC in the study period. Regions 1 and 2 have the least favorable socioeconomic status in Mexico (Table 5). In general, it has been observed that socioeconomic status is consistently associated with an increased risk for GC.22,23 Individuals of low socioeconomic status had a higher risk for GC (2.64, 95% CI 1.05-6.63) and a higher prevalence of infection by H. pylori.24
Socioeconomic regions of Mexico.
| Socioeconomic regions | States |
|---|---|
| 1 | Chiapas, Guerrero, Oaxaca |
| 2 | Campeche, Hidalgo, Puebla, San Luis Potosi, Tabasco, Veracruz |
| 3 | Durango, Guanajuato, Michoacan, Tlaxcala, Zacatecas |
| 4 | Colima, State of México, Morelos, Nayarit, Querétaro, Quintana Roo, Sinaloa, Yucatan |
| 5 | Baja California, Baja California Sur, Chihuahua, Sonora, Tamaulipas |
| 6 | Aguascalientes, Coahuila, Jalisco, Nuevo León |
| 7 | Mexico City |
Source: National Institute of Statistics and Geography (INEGI).
The highest prevalence of H. pylori occurs in rural areas, where drinking water is scarce, the educational level is low, and hygienic conditions are poor.22,23 Regions 1 and 2 show the above characteristics, and both were formed by states with a high level of marginalization.25 These regions have a great percentage of rural areas, thus region 1 included: Chiapas 54%, Guerrero 45%, and Oaxaca 55%; and region 2: Campeche 25%, Hidalgo 48%, Puebla 28%, San Luis Potosi 36%, Tabasco 43%, and Veracruz 39%.26 Torres et al.21 found that the states comprising region 1 (Table 5) in 1991 had the highest mortality from GC (mortality rate ≥ 6 per 100,000 individuals), with a 66% seroprevalence of H. pylori.
The YPLL is a measure of the relative impact of various diseases and health problems affecting society, which shows the losses suffered by society as a result of the death of young people or premature deaths.12 Of the 32 states, 15 presented an increase in YPLL rates, whereas 17 showed a decrease (considering the years 2000 and 2012).
The state with the highest YPLL rate during the study period was Chiapas (in 2000 the rate was 97.4 and in 2012 it was 79.6), which is one of the most marginalized states in the country. Other studies conducted in Mexico have reported that Chiapas had the highest rate of premature death due to GC in the country. Tovar-Guzman et al.15 found that within the time frame of 1980-1997, Chiapas had the highest YPLL rate (men 169.51, 95% CI 166.8-172.2; women 192.52, 95% CI 189.3-195.7).
Mexico has a program for the prevention and treatment of cancer in individuals under 18 years of age that is conducted by the Mexican Department of Health's National Council for the Prevention and Treatment of Cancer in Childhood and Adolescence. However, no such program for the prevention and treatment of GC exists in Mexico and it is a necessity. In other countries with a high incidence of GC, such as China and Japan, screening programs by endoscopy and epidemiological surveillance in individuals at high risk have been cost-effective strategies, because they have detected between 50 and 80% of cases at early stages of the disease. Once identified, high-risk individuals can be monitored by endoscopy for the detection of GC at an early stage.5 Although GC screening via endoscopy appears to be a good protective opportunity for the population, its effect on mortality reduction and its cost-effectiveness remain uncertain. The overall sensitivity of endoscopy for GC screening ranges from 78 to 84%. Nevertheless, in spite of these promising data, the technique depends heavily on the skills of the endoscopist, patient compliance to endoscopy is poor, adverse events may occur, and it is an expensive procedure. Therefore, mass screening by endoscopy is likely to be unfeasible. The cost of endoscopy in countries like Korea is quite low and facilitates systematic population-based screening. However, endoscopy is an expensive procedure in most countries, so screening cost-effectiveness needs to be evaluated by correlating GC incidence with the associated testing costs in different countries.27
In countries with a low incidence of GC, such as the United States and Mexico, endoscopy is costly and unwarranted. In low-risk countries like Mexico, only people with certain conditions such as atrophic gastritis, intestinal metaplasia, gastric ulcer, or dysplasia may benefit from gastric cancer screening.28,29
ConclusionsA total of 69,107 individuals died of GC within the time frame of the study in Mexico. Using the world population age distribution as the standard, the age-adjusted mortality rate per 100,000 inhabitants that died from GC decreased from 7.5 to 5.6 between 2000 and 2012. There was a greater number of deaths in men than in women, with 36,974 (53.5%) and 32,133 cases (46.5%), respectively, resulting in a male:female ratio of 1.15:1.0. Chiapas had the highest mortality rate from GC (9.2, 95% CI 8.2-10.3 [2000] and 8.2, 95% CI 7.3-9 [2012]), as did the socioeconomic regions 1, 2, and 5. Chiapas and socioeconomic region 1 had the highest rate of YPLL of the study.
Ethical responsibilitiesProtection of persons and animalsThe authors declare that no experiments were performed on humans or animals for this study.
Data confidentialityThe authors declare that no patient data appear in this article.
Right to privacy and informed consentThe authors declare that no patient data appear in this article.
Financial disclosureNo financial support was received in relation to this study.
Conflict of interestThe authors declare that there is no conflict of interest.
Please cite this article as: Sánchez-Barriga JJ. Tendencias de mortalidad y años potenciales de vida perdidos por cáncer gástrico en México, 2000-2012. Revista de Gastroenterología de México. 2016;82:65–73.
See related content at DOI: 10.1016/j.rgmxen.2016.02.007, Meza-Junco J, Montano-Loza AJ. Gastric cancer in Mexico: Improvement, but still a long way to go. Rev Gastroenterol Méx. 2016;81(2):63–4.
articles


www.publicationethics.org.