Post-infectious irritable bowel syndrome (PI-IBS) prevalence, small intestinal bacterial overgrowth (SIBO), altered microbiota, low-grade inflammation, and antibiotic therapy in IBS are all controversial issues.
AimsTo conduct an evidence-based review of these factors.
MethodsA review of the literature was carried out up to July 2012, with the inclusion of additional articles as far as August 2013, all of which were analyzed through the Oxford Centre for Evidence-Based Medicine (OCEBM) system.
Results1. There is greater SIBO probability in IBS when breath tests are performed, but prevalence varies widely (2-84%). 2. The gut microbiota in individuals with IBS is different from that in healthy subjects, but a common characteristic present in all the patients has not been established. 3. The incidence and prevalence of PI-IBS varies from 9-10% and 3-17%, respectively, and the latter decreases over time. Bacterial etiology is the most frequent but post-viral and parasitic cases have been reported. 4. A sub-group of patients has increased enterochromaffin cells, intraepithelial lymphocytes, and mast cells in the intestinal mucosa, but no differences between PI-IBS and non PI-IBS have been determined. 5. Methanogenic microbiota has been associated with IBS with constipation. 6. Rifaximin at doses of 400mg TID/10 days or 550mg TID/14 days is an effective treatment for the majority of overall symptoms and abdominal bloating in IBS. Retreatment effectiveness appears to be similar to that of the first cycle.
ConclusionsFurther studies are required to determine the nature of the gut microbiota in IBS and the differences in low-grade inflammation between PI-IBS and non PI-IBS. Rifaximin has shown itself to be an effective treatment for IBS, regardless of prior factors.
Existen controversias sobre la prevalencia del síndrome de intestino irritable (SII)-postinfeccioso (PI), sobrepoblación bacteriana (SPB), alteraciones en la microbiota, inflamación de bajo grado y antibioticoterapia en SII.
ObjetivosRealizar una revisión basada en evidencia de estos factores.
MétodosSe realizó una revisión de la literatura hasta julio del 2012 y se incluyeron artículos adicionales hasta agosto del 2013, los cuales fueron analizados mediante el sistema del Centro para Medicina Basada en Evidencia de la Universidad de Oxford (OCEBM).
Resultados1.Existe mayor probabilidad de SPB mediante pruebas de aliento pero la prevalencia es muy variable (2-84%). 2.La microbiota intestinal es diferente en SII que en sujetos sanos, pero no se ha establecido una característica común presente en todos los pacientes. 3.La incidencia y prevalencia del SII-PI varía del 9-10% y 3-17%, respectivamente; esta última disminuye con el tiempo. La etiología bacteriana es la más frecuente, pero se han reportado casos posvirales y parasitarios. 4.Existe un subgrupo de pacientes con incremento de células enterocromafines, linfocitos intraepiteliales y mastocitos en la mucosa intestinal, pero no se han determinado diferencias entre SII-PI y SII-NoPI. 5.La microbiota metanogénica se asocia con el SII con estreñimiento. 6.La rifaximina en dosis de 400mg TID/10días o 550mg TID/14días es efectiva en la mejoría de síntomas globales y distensión abdominal en SII. La efectividad del retratamiento parece ser similar a la del primer ciclo.
ConclusionesSe requieren más estudios para determinar la microbiota intestinal propia del SII y las diferencias en inflamación de bajo grado entre SII-PI y SII-NoPI. La rifaximina ha demostrado efectividad en el tratamiento del SII independientemente de los factores anteriores.
The pathophysiology of irritable bowel syndrome (IBS) is not completely understood, but various mechanisms such as gastrointestinal motility disturbances, visceral hypersensitivity, altered bidirectional brain-gut communication, psychosocial alterations, and stress have been proposed.1 More recently a group of patients has been described that develop IBS after gastrointestinal infections, known as post-infectious (PI) IBS.2 Likewise, the presence of small intestinal bacterial overgrowth (SIBO) in quantitative and qualitative gut and fecal microbiota disruptions has been reported.3–4 IBS has also been associated with the presence of low-grade inflammation in the intestinal mucosa resulting from an increase in the number of intraepithelial lymphocytes, mast cells, and enterochromaffin cells,5 without minimizing the fact that immunity alterations have been described at the peripheral level; such is the case with low levels of interleukin (IL)-10 and the increase of some pro-inflammatory interleukins such as tumor necrosis factor alpha (TNF-α) and other inflammation mediators.6 In fact, it is thought that alterations in the microbiota or SIBO in the small bowel could increase intestinal permeability, activating submucosal immunologic mechanisms that in turn could lead to low-grade inflammation.7 Furthermore, the mediators of this immunologic activation could stimulate enteric nervous system terminals, and even the autonomic nervous system, triggering the visceral sensitivity and motility alterations that have been described in IBS.7–8 On the other hand, the presence of PI-IBS, changes in the microbiota, and the association with SIBO in IBS have brought about the justification of antibiotic use in IBS treatment.8–9
Nevertheless, despite all the above, evidence is sometimes controversial. On the one hand, only one group of patients develops PI-IBS and not all the patients present with SIBO.9–10 The latter is even more limited due to the fact that the breath tests for diagnosing SIBO have not been standardized and vary among studies.11 Moreover, the disturbances in the microbiota are diverse and there is a wide variety of techniques for studying them, including the most sophisticated genomic tests.12 Similarly, the presence of low-grade inflammation is not universal and the alterations described differ among studies, in fact, it is uncertain whether these changes that present in some IBS patients are related only to PI-IBS.13 Finally, the studies on antibiotics in IBS have evaluated different doses, for different periods of time, and different outcome variables.14–15
Consequently, our aim was to carry out an evidence-based review on the following aspects of IBS: 1. The frequency of SIBO in IBS. 2. The incidence and prevalence of PI-IBS and its risk factors. 3. To determine the alterations in the intestinal and/or fecal microbiota in IBS. 4. To determine the presence of bowel inflammation in IBS, analyzing the differences between PI-IBS and non PI-IBS. 5. To understand the altered intestinal function (motility, secretion, visceral sensitivity) in IBS, in relation to PI-IBS, SIBO, and microbiota disturbances. 6. To evaluate antimicrobial treatment in IBS.
2Methods2.1Coordinator and reviewersThis initiative was carried out by a group of Mexican gastroenterologists interested in the subject. The coordinator of the group is an IBS expert (MS) and the participants were chosen based on their experience in gastroenterology and their training and participation in clinical and basic research related to the theme. An expert in the classification of levels of evidence and grades of recommendation (MP) with experience and training in gastroenterology, as well as clinical and statistical research, but who is not an IBS expert, was also included in the group. This was purposely done so that there would be both a different perspective and a more objective evidence evaluation. The 9 reviewers were divided into 6 reviewer groups (MB, RC-AH, ALC-JLT, YLV-MAV, MRT and MS), each receiving one of the 6 issues to be reviewed.
The project coordinator did a preliminary literature review in PubMed, using the MEDLINE database and including articles written up to July 2012. The following search terms were employed: «IBS» AND «SIBO», «abnormal breath test», «incidence of post infectious IBS», «prevalence of post infectious IBS», «microbiota», «Post infectious IBS» AND «risk factors», «epidemiology», «low grade inflammation», «Microbiota», «dysbacteriosis», «SIBO», «methane» AND intestinal function», «intestinal motility», «sensory function», «sensory abnormalities», «visceral hypersensitivity».
Once identified, the articles were distributed to those responsible for each theme to be reviewed. Systematic reviews with or without meta-analyses and original articles were selected. Narrative reviews were not included. In addition, the reviewers were authorized to include articles that were not selected in the initial review, but that were identified from other sources, such as from the references of an article originally chosen, or articles published after July 2012 and up to August 31, 2013, when the preparation of the manuscript concluded. All participants received a set of instructions by email with respect to the information to be obtained from the publications, as well as the methodology for classifying the levels of evidence and grades of recommendation.
2.2Evidence gradingThe reviewers analyzed the evidence and elaborated statements based on the available information. The levels of evidence and grades of recommendation were evaluated and graded using the Oxford Centre for Evidence-Based Medicine (OCEBM) system.16 This system utilizes numbers and letters to evaluate the quality and the level of evidence of clinical studies. Quality and methodology are established with the numbers 1 through 5 and the lower case letter «a», «b», or «c». The numbers indicate the quality of the studies and the letters indicate the methodology employed. For example, a 1a study is usually a systematic review that only includes high quality, homogeneous, controlled clinical trials (the number 1 indicates that only high quality homogeneous controlled clinical trials were included and the letter «a» indicates that it is a systematic review); a 2 a study is a systematic review (letter «a») that includes cohort studies of different quality that are methodologically considered to be of lower quality and level (number 2) than the controlled clinical trials. A final example: 2 b is a single individual cohort or a single controlled clinical trial (letter «b») of low quality (number 2).
The grade of recommendation is given in the upper case letters A through D. The letter A is for statements, conclusions, or recommendations based on information obtained from high quality or level 1 evidence, whereas letter D is given to recommendations based on studies of low scientific quality or level 5 evidence.16
2.3Evidence analysisThe first face-to-face meeting of the group was held in August 2012 and lasted 9hours. First the OCEBM system was discussed and then the reviewers presented a summary of each selected article in tables, including authors, journal, year, country, type of article (systematic review or original) and design, diagnostic criteria for IBS, and other selection criteria for the subjects, study methods and/or evaluated treatment, outcome variables, and results or conclusions. In addition, the reviewers responsible for each theme proposed a level of evidence for each of the studies and then presented the statements or declarations and their grades of recommendation. Each of the assigned levels of evidence was discussed and were modified and accepted by consensus; the same was done for the grades of recommendation. Finally, the coordinator presented a summary of each one and its pending work. In January 2013 the second meeting was held, lasting 8hours, and only the 6 updated reviews were presented. Then in March 2013 each reviewer sent his or her written participation to the coordinator who then sent each of the sections to be cross-reviewed. In other words, each reviewer or reviewer group went over another group's section. Once this cross-review was completed, the coordinator proceeded to edit the manuscript, after which it was reviewed again by all the participants.
3ResultsIn the preliminary PubMed review, 183 references were identified; 60 were eliminated because they were duplicated, leaving 123 selected articles. Later, 9 additional articles from other sources were added. The articles identified in the initial search and those selected from other sources are described in each section. The results of the 6 aspects covered in the review are described below. Each section begins with the statements and their respective levels of evidence and grades of recommendation, followed by the corresponding summary.
3.11. Frequency of small intestinal bacterial overgrowth (SIBO) in irritable bowel syndrome- •
Different studies have suggested that patients with IBS have a greater probability of having SIBO, determined through hydrogen breath tests (level 3 evidence, grade B recommendation).
- •
The reported prevalence of SIBO in patients with IBS varies widely due to the different criteria for defining a positive breath test and the methodology employed (28 to 84% with the lactulose breath test [LBT], 2 to 31% with the glucose breath test [GBT], and 2 to 6% based on cultures) (level 3-4 evidence, grade C recommendation).
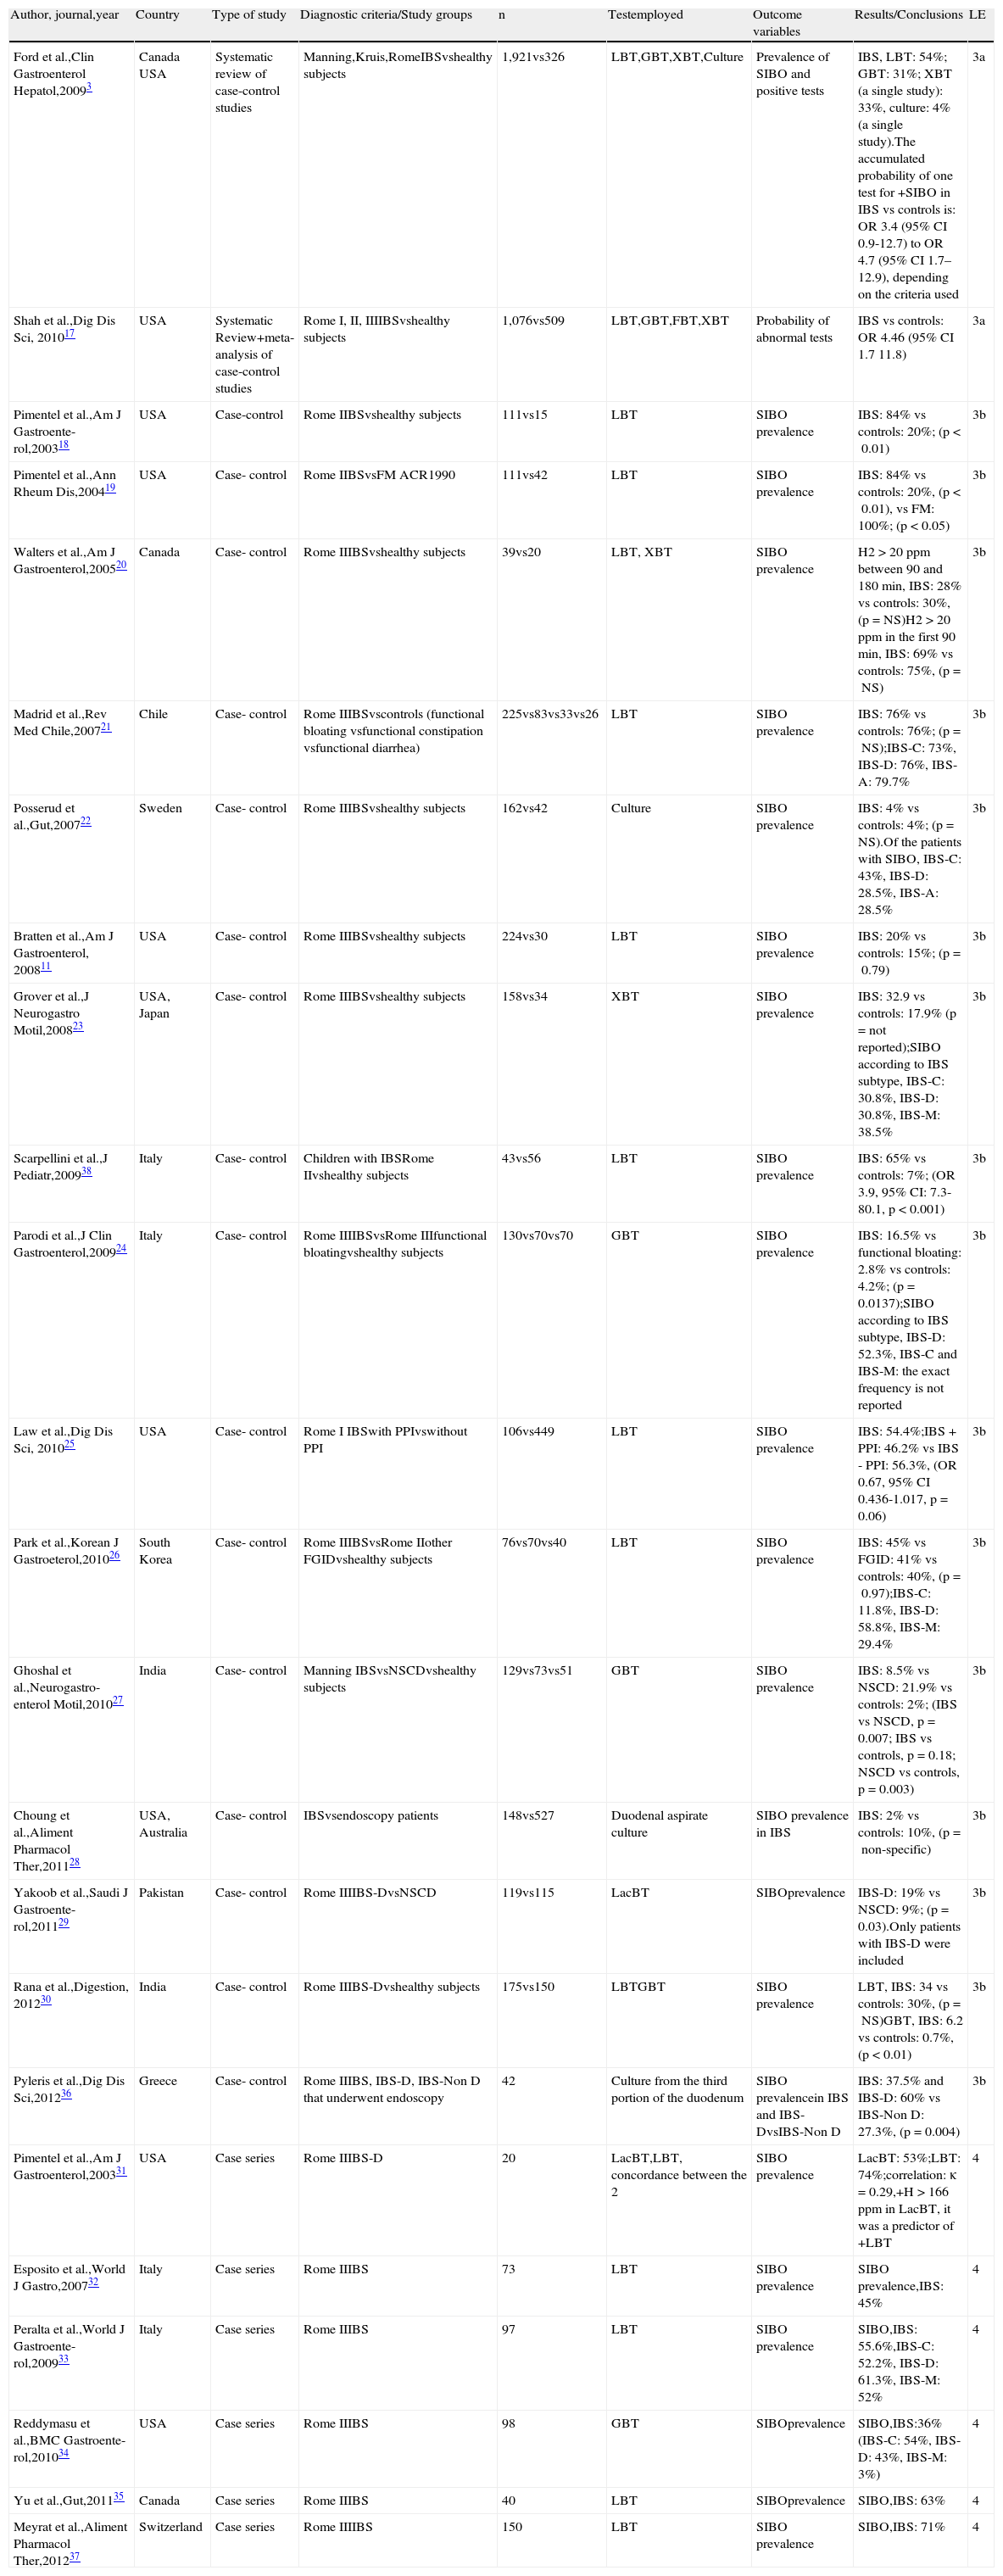
Twenty-four articles were identified that reported on the prevalence of SIBO in IBS; 3,11,17–38 23 articles during the initial search,3,11,17–35,37–38 and an additional article identified through manual search during the preparation of the document.36 Two systematic reviews with a meta-analysis that included more than 3,400 subjects and compared patients with IBS and healthy controls showed that the breath tests for SIBO were abnormal in the patients, with a 4-times higher probability than the controls.3,17 An extensive bibliographic search was carried out in both reviews, the studies were adequately selected, and the authors made a clear reference to the heterogeneity of the studies (Table 1).
Prevalence of SIBO in IBS.
| Author, journal,year | Country | Type of study | Diagnostic criteria/Study groups | n | Testemployed | Outcome variables | Results/Conclusions | LE |
| Ford et al.,Clin Gastroenterol Hepatol,20093 | Canada USA | Systematic review of case-control studies | Manning,Kruis,RomeIBSvshealthy subjects | 1,921vs326 | LBT,GBT,XBT,Culture | Prevalence of SIBO and positive tests | IBS, LBT: 54%; GBT: 31%; XBT (a single study): 33%, culture: 4% (a single study).The accumulated probability of one test for +SIBO in IBS vs controls is: OR 3.4 (95% CI 0.9-12.7) to OR 4.7 (95% CI 1.7–12.9), depending on the criteria used | 3a |
| Shah et al.,Dig Dis Sci, 201017 | USA | Systematic Review+meta-analysis of case-control studies | Rome I, II, IIIIBSvshealthy subjects | 1,076vs509 | LBT,GBT,FBT,XBT | Probability of abnormal tests | IBS vs controls: OR 4.46 (95% CI 1.7 11.8) | 3a |
| Pimentel et al.,Am J Gastroente-rol,200318 | USA | Case-control | Rome IIBSvshealthy subjects | 111vs15 | LBT | SIBO prevalence | IBS: 84% vs controls: 20%; (p<0.01) | 3b |
| Pimentel et al.,Ann Rheum Dis,200419 | USA | Case- control | Rome IIBSvsFM ACR1990 | 111vs42 | LBT | SIBO prevalence | IBS: 84% vs controls: 20%, (p<0.01), vs FM: 100%; (p<0.05) | 3b |
| Walters et al.,Am J Gastroenterol,200520 | Canada | Case- control | Rome IIIBSvshealthy subjects | 39vs20 | LBT, XBT | SIBO prevalence | H2>20ppm between 90 and 180min, IBS: 28% vs controls: 30%, (p=NS)H2>20ppm in the first 90min, IBS: 69% vs controls: 75%, (p=NS) | 3b |
| Madrid et al.,Rev Med Chile,200721 | Chile | Case- control | Rome IIIBSvscontrols (functional bloating vsfunctional constipation vsfunctional diarrhea) | 225vs83vs33vs26 | LBT | SIBO prevalence | IBS: 76% vs controls: 76%; (p=NS);IBS-C: 73%, IBS-D: 76%, IBS-A: 79.7% | 3b |
| Posserud et al.,Gut,200722 | Sweden | Case- control | Rome IIIBSvshealthy subjects | 162vs42 | Culture | SIBO prevalence | IBS: 4% vs controls: 4%; (p=NS).Of the patients with SIBO, IBS-C: 43%, IBS-D: 28.5%, IBS-A: 28.5% | 3b |
| Bratten et al.,Am J Gastroenterol, 200811 | USA | Case- control | Rome IIIBSvshealthy subjects | 224vs30 | LBT | SIBO prevalence | IBS: 20% vs controls: 15%; (p=0.79) | 3b |
| Grover et al.,J Neurogastro Motil,200823 | USA, Japan | Case- control | Rome IIIBSvshealthy subjects | 158vs34 | XBT | SIBO prevalence | IBS: 32.9 vs controls: 17.9% (p=not reported);SIBO according to IBS subtype, IBS-C: 30.8%, IBS-D: 30.8%, IBS-M: 38.5% | 3b |
| Scarpellini et al.,J Pediatr,200938 | Italy | Case- control | Children with IBSRome IIvshealthy subjects | 43vs56 | LBT | SIBO prevalence | IBS: 65% vs controls: 7%; (OR 3.9, 95% CI: 7.3-80.1, p<0.001) | 3b |
| Parodi et al.,J Clin Gastroenterol,200924 | Italy | Case- control | Rome IIIIBSvsRome IIIfunctional bloatingvshealthy subjects | 130vs70vs70 | GBT | SIBO prevalence | IBS: 16.5% vs functional bloating: 2.8% vs controls: 4.2%; (p=0.0137);SIBO according to IBS subtype, IBS-D: 52.3%, IBS-C and IBS-M: the exact frequency is not reported | 3b |
| Law et al.,Dig Dis Sci, 201025 | USA | Case- control | Rome I IBSwith PPIvswithout PPI | 106vs449 | LBT | SIBO prevalence | IBS: 54.4%;IBS + PPI: 46.2% vs IBS - PPI: 56.3%, (OR 0.67, 95% CI 0.436-1.017, p=0.06) | 3b |
| Park et al.,Korean J Gastroeterol,201026 | South Korea | Case- control | Rome IIIBSvsRome IIother FGIDvshealthy subjects | 76vs70vs40 | LBT | SIBO prevalence | IBS: 45% vs FGID: 41% vs controls: 40%, (p=0.97);IBS-C: 11.8%, IBS-D: 58.8%, IBS-M: 29.4% | 3b |
| Ghoshal et al.,Neurogastro-enterol Motil,201027 | India | Case- control | Manning IBSvsNSCDvshealthy subjects | 129vs73vs51 | GBT | SIBO prevalence | IBS: 8.5% vs NSCD: 21.9% vs controls: 2%; (IBS vs NSCD, p=0.007; IBS vs controls, p=0.18; NSCD vs controls, p=0.003) | 3b |
| Choung et al.,Aliment Pharmacol Ther,201128 | USA, Australia | Case- control | IBSvsendoscopy patients | 148vs527 | Duodenal aspirate culture | SIBO prevalence in IBS | IBS: 2% vs controls: 10%, (p=non-specific) | 3b |
| Yakoob et al.,Saudi J Gastroente-rol,201129 | Pakistan | Case- control | Rome IIIIBS-DvsNSCD | 119vs115 | LacBT | SIBOprevalence | IBS-D: 19% vs NSCD: 9%; (p=0.03).Only patients with IBS-D were included | 3b |
| Rana et al.,Digestion, 201230 | India | Case- control | Rome IIIBS-Dvshealthy subjects | 175vs150 | LBTGBT | SIBO prevalence | LBT, IBS: 34 vs controls: 30%, (p=NS)GBT, IBS: 6.2 vs controls: 0.7%, (p<0.01) | 3b |
| Pyleris et al.,Dig Dis Sci,201236 | Greece | Case- control | Rome IIIBS, IBS-D, IBS-Non D that underwent endoscopy | 42 | Culture from the third portion of the duodenum | SIBO prevalencein IBS and IBS-DvsIBS-Non D | IBS: 37.5% and IBS-D: 60% vs IBS-Non D: 27.3%, (p=0.004) | 3b |
| Pimentel et al.,Am J Gastroenterol,200331 | USA | Case series | Rome IIIBS-D | 20 | LacBT,LBT, concordance between the 2 | SIBO prevalence | LacBT: 53%;LBT: 74%;correlation: κ=0.29,+H>166ppm in LacBT, it was a predictor of +LBT | 4 |
| Esposito et al.,World J Gastro,200732 | Italy | Case series | Rome IIIBS | 73 | LBT | SIBO prevalence | SIBO prevalence,IBS: 45% | 4 |
| Peralta et al.,World J Gastroente-rol,200933 | Italy | Case series | Rome IIIBS | 97 | LBT | SIBO prevalence | SIBO,IBS: 55.6%,IBS-C: 52.2%, IBS-D: 61.3%, IBS-M: 52% | 4 |
| Reddymasu et al.,BMC Gastroente-rol,201034 | USA | Case series | Rome IIIBS | 98 | GBT | SIBOprevalence | SIBO,IBS:36% (IBS-C: 54%, IBS-D: 43%, IBS-M: 3%) | 4 |
| Yu et al.,Gut,201135 | Canada | Case series | Rome IIIBS | 40 | LBT | SIBOprevalence | SIBO,IBS: 63% | 4 |
| Meyrat et al.,Aliment Pharmacol Ther,201237 | Switzerland | Case series | Rome IIIIBS | 150 | LBT | SIBO prevalence | SIBO,IBS: 71% | 4 |
The studies are organized from higher to lower level of evidence and then in the progressive order of publication year. The prevalence of SIBO is only given according to the IBS subtypes in the studies that reported them.
ACR: American College of Rheumatology; FBT: fructose breath test; FGID: functional gastrointestinal disorders; FM: fibromyalgia; GBT: glucose breath test; H2: exhaled hydrogen; IBS: irritable bowel syndrome; IBS-A: alternating irritable bowel syndrome; IBS-C: irritable bowel syndrome with constipation; IBS-D: irritable bowel syndrome with diarrhea; IBS-M: mixed irritable bowel syndrome; LacBT: lactose breath test; LBT: lactulose breath test; LE: level of evidence; 95% CI: 95% confidence interval; NSCD: non-specific chronic diarrhea; NS: not significant; N: number; OR: odds ratio; ppm: parts per million; PPI: proton pump inhibitors; SIBO: small intestinal bacterial overgrowth; XBT: xylose breath test.
On the other hand, a case series of patients with IBS that participated in an open study with rifaximin, showed a SIBO prevalence of 71% with LBT in IBS.37 In addition, 16 case-control studies11,18–30,36,38 provided information on SIBO prevalence in IBS, including the study by Pimentel et al.;18 the prevalence of this comparative controlled clinical trial with placebo was the result of a sub-analysis of the study population. A second study analyzed a series of consecutive patients with diverse digestive disorders that were referred for upper endoscopy; they had duodenal aspiration culture done to determine SIBO and IBS was considered a posteriori.36 In this same study SIBO was also compared in those patients with IBS-D and IBS-Non D, which made it incomparable with all the other studies.36 Of the 14 remaining studies, 5 demonstrated greater SIBO prevalence in IBS compared with the controls;3,17,19,24,38 7 showed equal prevalence,11,20–22,26–27,30 one showed lower prevalence in IBS,28 and one did not report the p value, although there appeared to have been a greater prevalence in IBS23 (Table 1). Among the analyses with greater prevalence in IBS, the study by Pimentel et al. stands out because it analyzed the prevalence of SIBO among patients with fibromyalgia, IBS, and healthy controls.19 The patients with fibromyalgia were selected regardless of their digestive symptoms and were the group with the highest SIBO prevalence, above that of the IBS patients and the healthy controls (100, 84, and 20%, respectively). It should be stressed that only one Latin American study was identified.21 In this study, Madrid et al., in Chile, found that the prevalence of SIBO was similar in patients with IBS, compared with that of other functional gastrointestinal disorders (IBS: 76%; functional constipation: 73%; functional diarrhea: 69%; and functional bloating: 68%).21 Another study analyzed patients treated with proton pump inhibitors (PPIs) vs those that were not, finding no apparent differences in SIBO frequency.25 And finally, two other studies compared IBS vs other functional gastrointestinal disorders (FGIDs).26,29 Six case series with a combined total of 478 patients were analyzed as well, and a prevalence of SIBO was reported in patients with IBS that varied from 36 to 74%, depending on the methods employed.31–35,37
The use of breath tests for diagnosing SIBO has been characterized by the lack of a standardized methodology and validated criteria for defining an abnormal test. In the majority of the studies lactulose was the substrate, but with a wide variety of doses, protocols for carrying out the tests, and criteria for determining that a test is abnormal. Walters et al. used the LBT and applied 2 different criteria in their interpretation.20 They included 39 patients with IBS and 20 healthy controls, finding a radically different SIBO prevalence in patients with IBS, even though there was no difference in the comparison with the healthy controls, regardless of the criterion used: 28% of the patients with IBS vs 30% of the control subjects when the criterion of more than 20ppm of H2 in the first 90min of the test was used, compared with 69% of the patients with IBS vs 75% of the controls when the criterion of more than 20ppm of H2 at any time during the first 180min of the test was employed.20 Furthermore, the accuracy of the LBT has been questioned because the decomposition of this substrate by the bacteria of the cecum usually produces a second spike in hydrogen detection that reduces its specificity. In contrast, the GBT, in which the substrate is completely absorbed in the proximal small bowel (duodenum), has shown a greater sensitivity and specificity for the detection of SIBO than the LBT.11 Rana et al. found a similar SIBO prevalence in IBS patients and healthy subjects utilizing the LBT (34 vs 30%, p = NS), but a higher prevalence of SIBO in IBS utilizing the GBT (6.2 vs 0.66%, p<0.01).30 Despite its apparently being a more precise test, it has been employed in fewer studies.24,27,32,36 Sucrose, another substrate that is totally absorbed in the small bowel and therefore theoretically more accurate, was used in only one of the selected studies.23
On the other hand, the presence of SIBO has also been defined based on the detection of an elevated bacterial count from small bowel fluid culture. The quantitative culture should then be regarded as the benchmark test for SIBO, but it has been utilized in very few studies. However, it would depend on the culture site and many bacteria are unculturable. Only 2 of the selected studies employed culture for detecting SIBO,22,28 and as mentioned before, one of them reported a lower SIBO frequency in IBS vs control subjects with different pathologies that underwent endoscopy.28
We can therefore conclude that there is evidence suggesting a greater probability of SIBO in IBS according to breath test data, but there is not enough evidence for recommending the routine use of these tests for diagnosing SIBO in IBS.
3.22. Alterations in the gut microbiota (dysbiosis) in irritable bowel syndrome- •
The composition of the microbiota in patients with IBS is different from that of normal subjects (level 3 b evidence, grade B recommendation).
- •
Alterations in the composition of the microbiota -dysbiosis- occur in both adult and pediatric patients with IBS (level 3 b evidence, grade B recommendation).
- •
Due to the heterogeneity of IBS and the use of different methods for studying the gut microbiota, it is not possible to establish a microbial composition characteristic of IBS (level 3 b evidence, grade B recommendation).
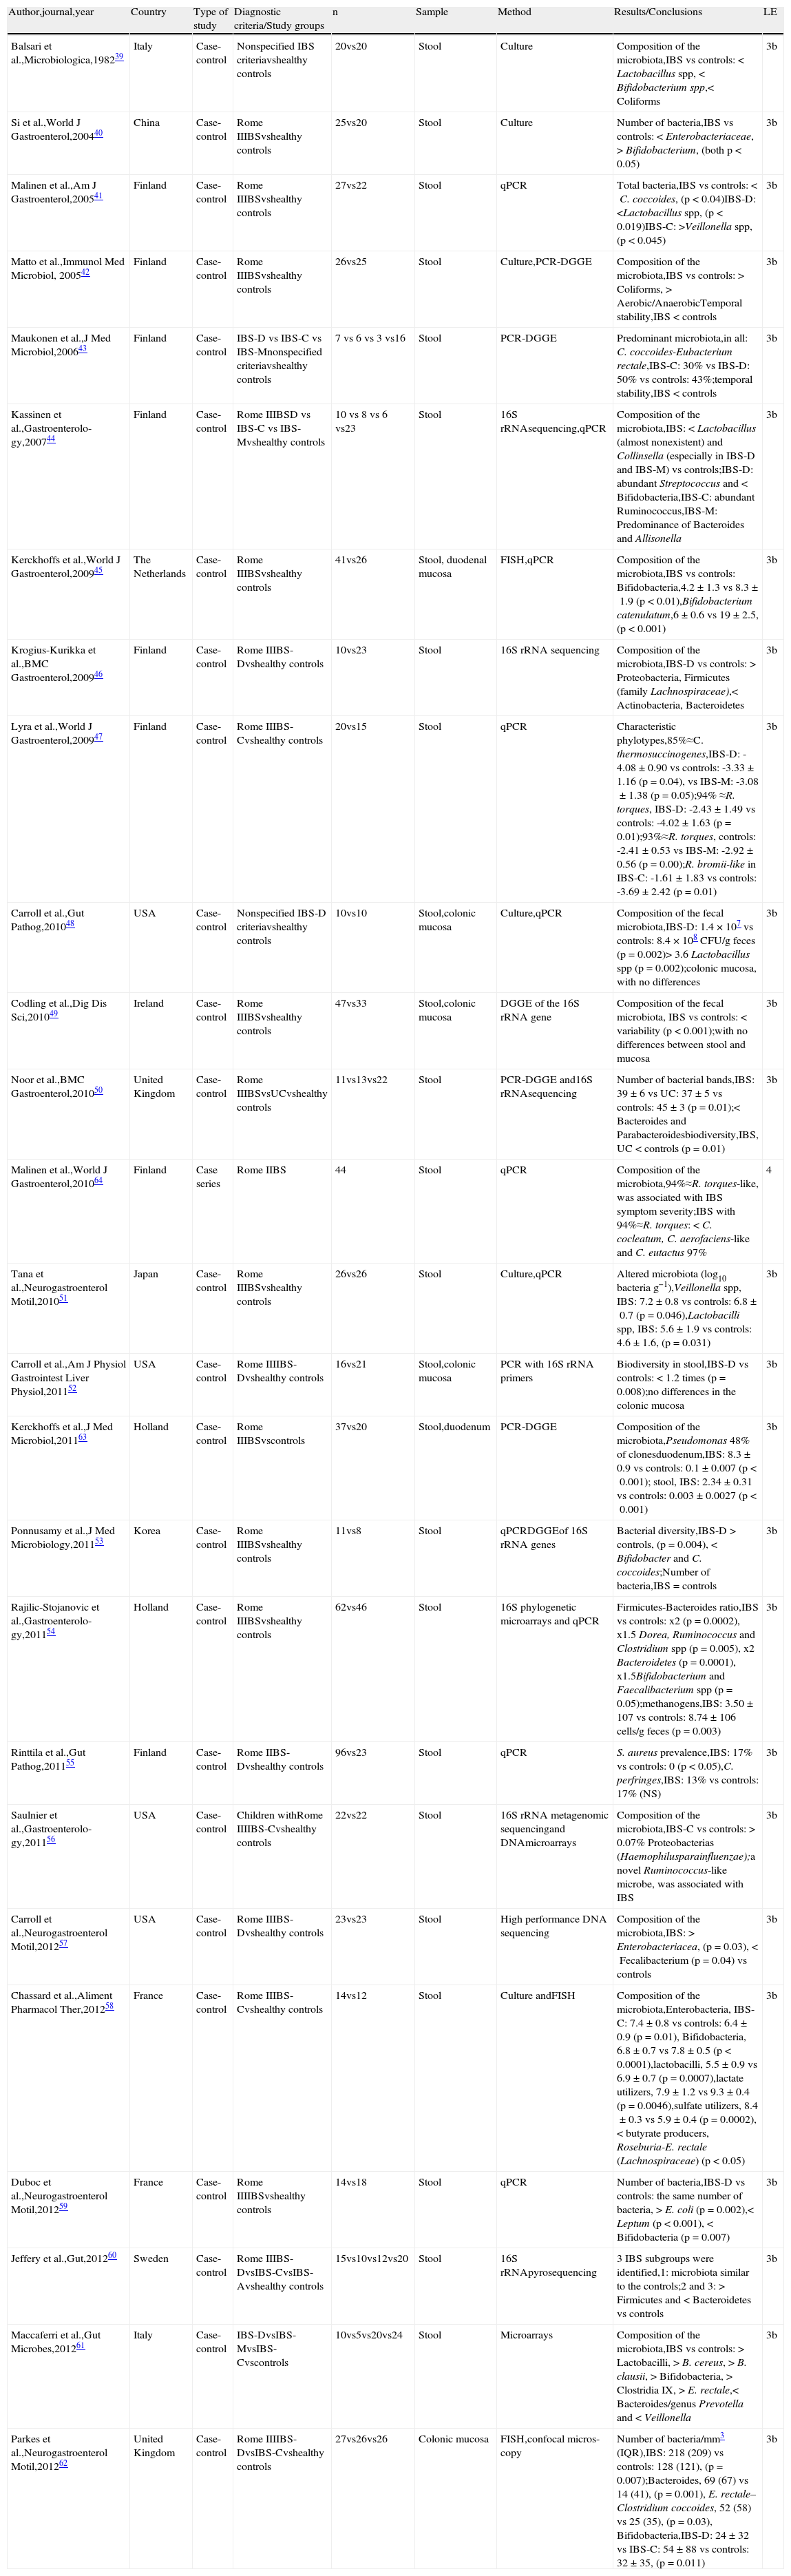
Twenty-six published articles were identified that studied the composition of the microbiota in patients with IBS; 24 in the initial search41–64 and 2 from other sources.39,40 All of them are case-control studies conducted in Europe, Asia, and the United States; none from Latin America or Africa. Twenty-five were carried out on adult population39–55,57–64 and only one on children.56 In 11 of the studies, the cases were classified according to the IBS subtype.41,43,46–48,52,55–56,60,62,64 The microbiota was analyzed with molecular methods in the majority of the studies, whereas just fecal culture was used in 2,39,40 and both methodologies were used in 4 studies.42,48,51,58 Even though the majority of the studies analyzed the composition of the microbiota in samples of fecal matter, the microbial composition was also examined in biopsies of the colonic mucosa in 4 of the studies. The predominant results of each of these studies and the summary of the microbial ecology of the gut microbiota in IBS are shown in Table 2.
Studies on the composition of the intestinal microbiota in patients with IBS.
| Author,journal,year | Country | Type of study | Diagnostic criteria/Study groups | n | Sample | Method | Results/Conclusions | LE |
| Balsari et al.,Microbiologica,198239 | Italy | Case-control | Nonspecified IBS criteriavshealthy controls | 20vs20 | Stool | Culture | Composition of the microbiota,IBS vs controls:<Lactobacillus spp,<Bifidobacterium spp,<Coliforms | 3b |
| Si et al.,World J Gastroenterol,200440 | China | Case-control | Rome IIIBSvshealthy controls | 25vs20 | Stool | Culture | Number of bacteria,IBS vs controls: <Enterobacteriaceae,>Bifidobacterium, (both p<0.05) | 3b |
| Malinen et al.,Am J Gastroenterol,200541 | Finland | Case-control | Rome IIIBSvshealthy controls | 27vs22 | Stool | qPCR | Total bacteria,IBS vs controls:<C. coccoides, (p<0.04)IBS-D: <Lactobacillus spp, (p<0.019)IBS-C: >Veillonella spp, (p<0.045) | 3b |
| Matto et al.,Immunol Med Microbiol, 200542 | Finland | Case-control | Rome IIIBSvshealthy controls | 26vs25 | Stool | Culture,PCR-DGGE | Composition of the microbiota,IBS vs controls: > Coliforms, > Aerobic/AnaerobicTemporal stability,IBS < controls | 3b |
| Maukonen et al.,J Med Microbiol,200643 | Finland | Case-control | IBS-D vs IBS-C vs IBS-Mnonspecified criteriavshealthy controls | 7 vs 6 vs 3 vs16 | Stool | PCR-DGGE | Predominant microbiota,in all: C. coccoides-Eubacterium rectale,IBS-C: 30% vs IBS-D: 50% vs controls: 43%;temporal stability,IBS < controls | 3b |
| Kassinen et al.,Gastroenterolo-gy,200744 | Finland | Case-control | Rome IIIBSD vs IBS-C vs IBS-Mvshealthy controls | 10 vs 8 vs 6 vs23 | Stool | 16S rRNAsequencing,qPCR | Composition of the microbiota,IBS: < Lactobacillus (almost nonexistent) and Collinsella (especially in IBS-D and IBS-M) vs controls;IBS-D: abundant Streptococcus and < Bifidobacteria,IBS-C: abundant Ruminococcus,IBS-M: Predominance of Bacteroides and Allisonella | 3b |
| Kerckhoffs et al.,World J Gastroenterol,200945 | The Netherlands | Case-control | Rome IIIBSvshealthy controls | 41vs26 | Stool, duodenal mucosa | FISH,qPCR | Composition of the microbiota,IBS vs controls: Bifidobacteria,4.2±1.3 vs 8.3±1.9 (p<0.01),Bifidobacterium catenulatum,6±0.6 vs 19±2.5, (p<0.001) | 3b |
| Krogius-Kurikka et al.,BMC Gastroenterol,200946 | Finland | Case-control | Rome IIIBS-Dvshealthy controls | 10vs23 | Stool | 16S rRNA sequencing | Composition of the microbiota,IBS-D vs controls: > Proteobacteria, Firmicutes (family Lachnospiraceae),< Actinobacteria, Bacteroidetes | 3b |
| Lyra et al.,World J Gastroenterol,200947 | Finland | Case-control | Rome IIIBS-Cvshealthy controls | 20vs15 | Stool | qPCR | Characteristic phylotypes,85%≈C. thermosuccinogenes,IBS-D: -4.08±0.90 vs controls: -3.33±1.16 (p=0.04), vs IBS-M: -3.08±1.38 (p=0.05);94% ≈R. torques, IBS-D: -2.43±1.49 vs controls: -4.02±1.63 (p=0.01);93%≈R. torques, controls: -2.41±0.53 vs IBS-M: -2.92±0.56 (p=0.00);R. bromii-like in IBS-C: -1.61±1.83 vs controls: -3.69±2.42 (p=0.01) | 3b |
| Carroll et al.,Gut Pathog,201048 | USA | Case-control | Nonspecified IBS-D criteriavshealthy controls | 10vs10 | Stool,colonic mucosa | Culture,qPCR | Composition of the fecal microbiota,IBS-D: 1.4×10⁷ vs controls: 8.4×10⁸ CFU/g feces (p=0.002)> 3.6 Lactobacillus spp (p=0.002);colonic mucosa, with no differences | 3b |
| Codling et al.,Dig Dis Sci,201049 | Ireland | Case-control | Rome IIIBSvshealthy controls | 47vs33 | Stool,colonic mucosa | DGGE of the 16S rRNA gene | Composition of the fecal microbiota, IBS vs controls: < variability (p<0.001);with no differences between stool and mucosa | 3b |
| Noor et al.,BMC Gastroenterol,201050 | United Kingdom | Case-control | Rome IIIBSvsUCvshealthy controls | 11vs13vs22 | Stool | PCR-DGGE and16S rRNAsequencing | Number of bacterial bands,IBS: 39±6 vs UC: 37±5 vs controls: 45±3 (p=0.01);< Bacteroides and Parabacteroidesbiodiversity,IBS, UC < controls (p=0.01) | 3b |
| Malinen et al.,World J Gastroenterol,201064 | Finland | Case series | Rome IIBS | 44 | Stool | qPCR | Composition of the microbiota,94%≈R. torques-like, was associated with IBS symptom severity;IBS with 94%≈R. torques: < C. cocleatum, C. aerofaciens-like and C. eutactus 97% | 4 |
| Tana et al.,Neurogastroenterol Motil,201051 | Japan | Case-control | Rome IIIBSvshealthy controls | 26vs26 | Stool | Culture,qPCR | Altered microbiota (log10 bacteria g−1),Veillonella spp, IBS: 7.2±0.8 vs controls: 6.8±0.7 (p=0.046),Lactobacilli spp, IBS: 5.6±1.9 vs controls: 4.6±1.6, (p=0.031) | 3b |
| Carroll et al.,Am J Physiol Gastrointest Liver Physiol,201152 | USA | Case-control | Rome IIIIBS-Dvshealthy controls | 16vs21 | Stool,colonic mucosa | PCR with 16S rRNA primers | Biodiversity in stool,IBS-D vs controls: < 1.2 times (p=0.008);no differences in the colonic mucosa | 3b |
| Kerckhoffs et al.,J Med Microbiol,201163 | Holland | Case-control | Rome IIIBSvscontrols | 37vs20 | Stool,duodenum | PCR-DGGE | Composition of the microbiota,Pseudomonas 48% of clonesduodenum,IBS: 8.3±0.9 vs controls: 0.1±0.007 (p<0.001); stool, IBS: 2.34±0.31 vs controls: 0.003±0.0027 (p<0.001) | 3b |
| Ponnusamy et al.,J Med Microbiology,201153 | Korea | Case-control | Rome IIIBSvshealthy controls | 11vs8 | Stool | qPCRDGGEof 16S rRNA genes | Bacterial diversity,IBS-D > controls, (p=0.004), < Bifidobacter and C. coccoides;Number of bacteria,IBS=controls | 3b |
| Rajilic-Stojanovic et al.,Gastroenterolo-gy,201154 | Holland | Case-control | Rome IIIBSvshealthy controls | 62vs46 | Stool | 16S phylogenetic microarrays and qPCR | Firmicutes-Bacteroides ratio,IBS vs controls: x2 (p=0.0002), x1.5 Dorea, Ruminococcus and Clostridium spp (p=0.005), x2 Bacteroidetes (p=0.0001), x1.5Bifidobacterium and Faecalibacterium spp (p=0.05);methanogens,IBS: 3.50±107 vs controls: 8.74±106 cells/g feces (p=0.003) | 3b |
| Rinttila et al.,Gut Pathog,201155 | Finland | Case-control | Rome IIBS-Dvshealthy controls | 96vs23 | Stool | qPCR | S. aureus prevalence,IBS: 17% vs controls: 0 (p<0.05),C. perfringes,IBS: 13% vs controls: 17% (NS) | 3b |
| Saulnier et al.,Gastroenterolo-gy,201156 | USA | Case-control | Children withRome IIIIBS-Cvshealthy controls | 22vs22 | Stool | 16S rRNA metagenomic sequencingand DNAmicroarrays | Composition of the microbiota,IBS-C vs controls: > 0.07% Proteobacterias (Haemophilusparainfluenzae);a novel Ruminococcus-like microbe, was associated with IBS | 3b |
| Carroll et al.,Neurogastroenterol Motil,201257 | USA | Case-control | Rome IIIBS-Dvshealthy controls | 23vs23 | Stool | High performance DNA sequencing | Composition of the microbiota,IBS: > Enterobacteriacea, (p=0.03),<Fecalibacterium (p=0.04) vs controls | 3b |
| Chassard et al.,Aliment Pharmacol Ther,201258 | France | Case-control | Rome IIIBS-Cvshealthy controls | 14vs12 | Stool | Culture andFISH | Composition of the microbiota,Enterobacteria, IBS-C: 7.4±0.8 vs controls: 6.4±0.9 (p=0.01), Bifidobacteria, 6.8±0.7 vs 7.8±0.5 (p<0.0001),lactobacilli, 5.5±0.9 vs 6.9±0.7 (p=0.0007),lactate utilizers, 7.9±1.2 vs 9.3±0.4 (p=0.0046),sulfate utilizers, 8.4±0.3 vs 5.9±0.4 (p=0.0002),< butyrate producers, Roseburia-E. rectale (Lachnospiraceae) (p<0.05) | 3b |
| Duboc et al.,Neurogastroenterol Motil,201259 | France | Case-control | Rome IIIIBSvshealthy controls | 14vs18 | Stool | qPCR | Number of bacteria,IBS-D vs controls: the same number of bacteria, > E. coli (p=0.002),< Leptum (p<0.001), < Bifidobacteria (p=0.007) | 3b |
| Jeffery et al.,Gut,201260 | Sweden | Case-control | Rome IIIBS-DvsIBS-CvsIBS-Avshealthy controls | 15vs10vs12vs20 | Stool | 16S rRNApyrosequencing | 3 IBS subgroups were identified,1: microbiota similar to the controls;2 and 3: > Firmicutes and < Bacteroidetes vs controls | 3b |
| Maccaferri et al.,Gut Microbes,201261 | Italy | Case-control | IBS-DvsIBS-MvsIBS-Cvscontrols | 10vs5vs20vs24 | Stool | Microarrays | Composition of the microbiota,IBS vs controls: > Lactobacilli, > B. cereus, > B. clausii, > Bifidobacteria, > Clostridia IX, > E. rectale,< Bacteroides/genus Prevotella and < Veillonella | 3b |
| Parkes et al.,Neurogastroenterol Motil,201262 | United Kingdom | Case-control | Rome IIIIBS-DvsIBS-Cvshealthy controls | 27vs26vs26 | Colonic mucosa | FISH,confocal micros-copy | Number of bacteria/mm3 (IQR),IBS: 218 (209) vs controls: 128 (121), (p=0.007);Bacteroides, 69 (67) vs 14 (41), (p=0.001), E. rectale–Clostridium coccoides, 52 (58) vs 25 (35), (p=0.03), Bifidobacteria,IBS-D: 24±32 vs IBS-C: 54±88 vs controls: 32±35, (p=0.011) | 3b |
The studies are organized from higher to lower level of evidence and then in the progressive order of publication year.
A: alternating; C: constipation; D: diarrhea; DNA: deoxyribonucleic acid; FISH: fluorescence in situ hybridization; H2: hydrogen; IBS: irritable bowel syndrome; IQR: interquartile range; LE: level of evidence; N: number; PCR-DGGE: polymerase chain reaction-denaturing gradient gel electrophoresis; qPCR: quantitative polymerase chain reaction; RCT: randomized controlled trial; rRNA: ribosomal ribonucleic acid; spp: all the species of the genus referred to; UC: nonspecific chronic ulcerative colitis; >: increase; <:decrease;.
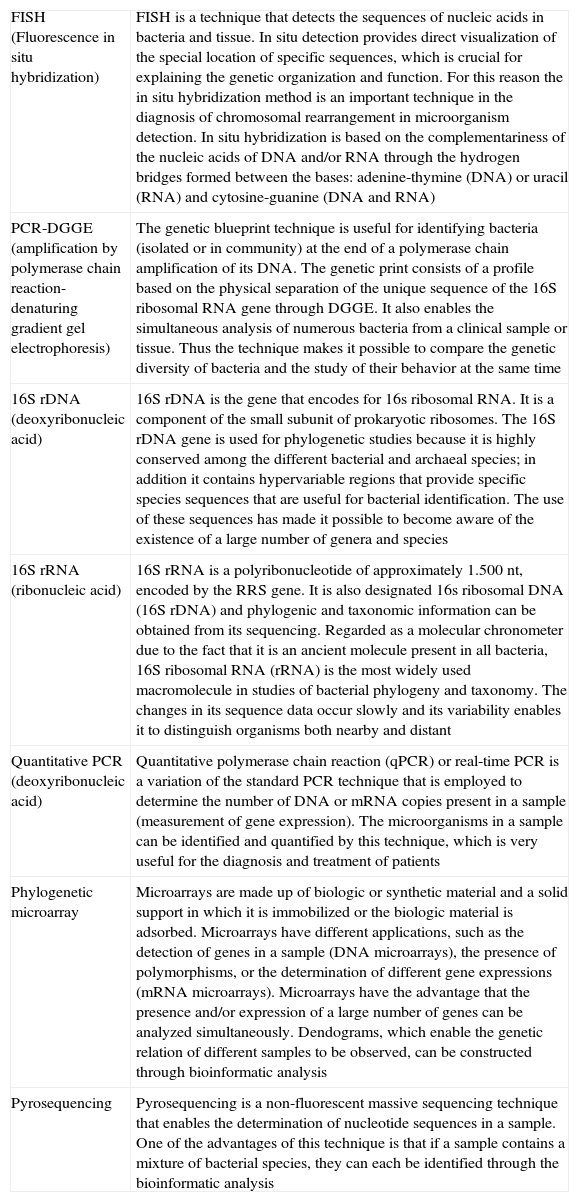
The investigations that used fecal cultures for studying the gut microbiota have shown that IBS patients, unlike healthy subjects, have a diminished population of bifidobacteria and lactobacilli and an increased population of streptococci, coliforms, and Clostridium species.39,40,42,51 Moreover, the majority of the studies used molecular methods independent of the culture, such as tests based on DNA extraction and amplification of the 16S genes of ribosomal RNA, quantitative PCR, the products of PCR through denaturing gradient gel electrophoresis, and probe-specific fluorescence in situ hybridization. The many different molecular strategies employed in these studies (Table 3) is the reason for the inconsistent and even contradictory results in relation to the composition and diversity of the microbiota in patients with IBS, as well as a single determination of the microbiota in the variable of time and the limited knowledge of new bacterial species that are still waiting to be described. Thus, even though it seems that the gut microbiota of patients with IBS is different from that of the controls, it is not yet possible to establish an intestinal microbial composition characteristic of IBS.
Molecular methods used in the microbiota analysis.
| FISH (Fluorescence in situ hybridization) | FISH is a technique that detects the sequences of nucleic acids in bacteria and tissue. In situ detection provides direct visualization of the special location of specific sequences, which is crucial for explaining the genetic organization and function. For this reason the in situ hybridization method is an important technique in the diagnosis of chromosomal rearrangement in microorganism detection. In situ hybridization is based on the complementariness of the nucleic acids of DNA and/or RNA through the hydrogen bridges formed between the bases: adenine-thymine (DNA) or uracil (RNA) and cytosine-guanine (DNA and RNA) |
| PCR-DGGE (amplification by polymerase chain reaction- denaturing gradient gel electrophoresis) | The genetic blueprint technique is useful for identifying bacteria (isolated or in community) at the end of a polymerase chain amplification of its DNA. The genetic print consists of a profile based on the physical separation of the unique sequence of the 16S ribosomal RNA gene through DGGE. It also enables the simultaneous analysis of numerous bacteria from a clinical sample or tissue. Thus the technique makes it possible to compare the genetic diversity of bacteria and the study of their behavior at the same time |
| 16S rDNA (deoxyribonucleic acid) | 16S rDNA is the gene that encodes for 16s ribosomal RNA. It is a component of the small subunit of prokaryotic ribosomes. The 16S rDNA gene is used for phylogenetic studies because it is highly conserved among the different bacterial and archaeal species; in addition it contains hypervariable regions that provide specific species sequences that are useful for bacterial identification. The use of these sequences has made it possible to become aware of the existence of a large number of genera and species |
| 16S rRNA (ribonucleic acid) | 16S rRNA is a polyribonucleotide of approximately 1.500 nt, encoded by the RRS gene. It is also designated 16s ribosomal DNA (16S rDNA) and phylogenic and taxonomic information can be obtained from its sequencing. Regarded as a molecular chronometer due to the fact that it is an ancient molecule present in all bacteria, 16S ribosomal RNA (rRNA) is the most widely used macromolecule in studies of bacterial phylogeny and taxonomy. The changes in its sequence data occur slowly and its variability enables it to distinguish organisms both nearby and distant |
| Quantitative PCR (deoxyribonucleic acid) | Quantitative polymerase chain reaction (qPCR) or real-time PCR is a variation of the standard PCR technique that is employed to determine the number of DNA or mRNA copies present in a sample (measurement of gene expression). The microorganisms in a sample can be identified and quantified by this technique, which is very useful for the diagnosis and treatment of patients |
| Phylogenetic microarray | Microarrays are made up of biologic or synthetic material and a solid support in which it is immobilized or the biologic material is adsorbed. Microarrays have different applications, such as the detection of genes in a sample (DNA microarrays), the presence of polymorphisms, or the determination of different gene expressions (mRNA microarrays). Microarrays have the advantage that the presence and/or expression of a large number of genes can be analyzed simultaneously. Dendograms, which enable the genetic relation of different samples to be observed, can be constructed through bioinformatic analysis |
| Pyrosequencing | Pyrosequencing is a non-fluorescent massive sequencing technique that enables the determination of nucleotide sequences in a sample. One of the advantages of this technique is that if a sample contains a mixture of bacterial species, they can each be identified through the bioinformatic analysis |
- •
The average incidence of PI-IBS has been reported as 9 to 10% with a 4 to 36% interval (level 1 a evidence, grade A recommendation).
- •
The prevalence of PI-IBS varies from 3 to 17% and decreases over time after gastrointestinal infection (level 3 b evidence, grade B recommendation).
- •
The most studied etiology in relation to PI-IBS is that of bacterial origin, and even though the viral and parasitic causes have scarcely been studied, they also appear to be risk factors for PI-IBS (level 2 b evidence, grade B recommendation).
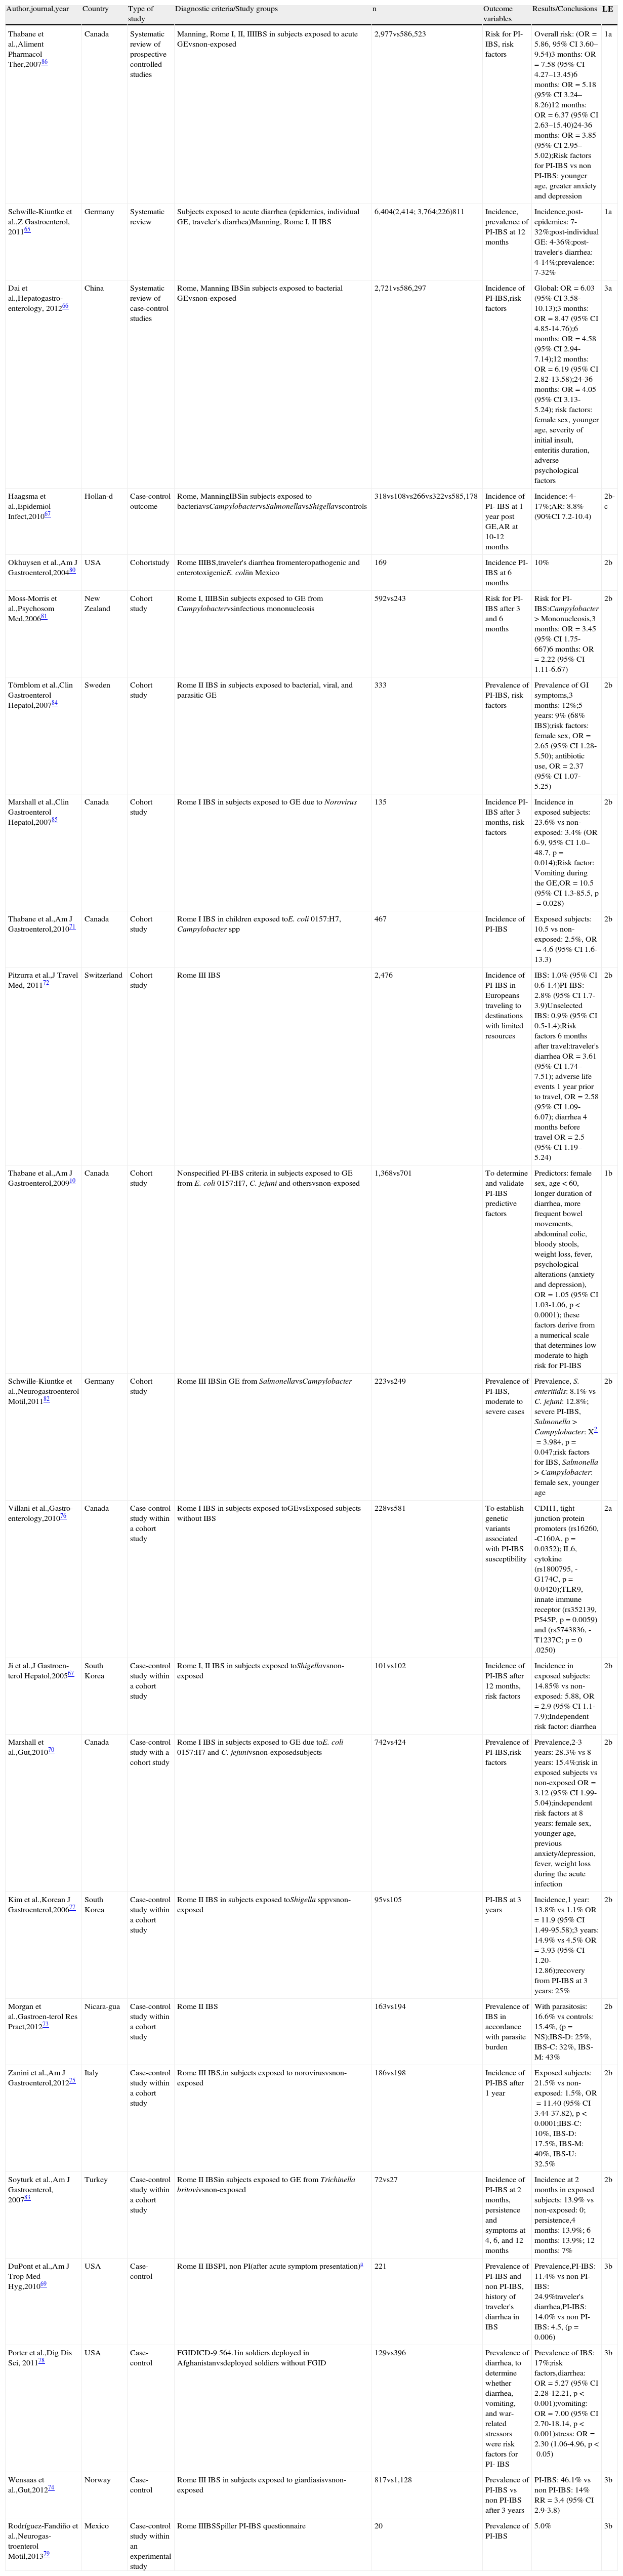
Twenty-three studies on PI-IBS were reviewed, 19 of which were identified in the initial search10,65–82 and 4 afterwards from other sources.83–86 Twelve studies reported the incidence of PI-IBS (new onset IBS),65–67,71–72,75,77,80,83,85 8 reported the prevalence,65,69,73,74,78,79,82,84 and 8 analyzed the risk factors related to the development of PI-IBS.10,66,70,72,82,84,86 All the studies were conducted on adult population, with the exception of one on pediatric population71 (Table 4).
Incidence, prevalence, and risk factors for PI-IBS.
| Author,journal,year | Country | Type of study | Diagnostic criteria/Study groups | n | Outcome variables | Results/Conclusions | LE |
| Thabane et al.,Aliment Pharmacol Ther,200786 | Canada | Systematic review of prospective controlled studies | Manning, Rome I, II, IIIIBS in subjects exposed to acute GEvsnon-exposed | 2,977vs586,523 | Risk for PI-IBS, risk factors | Overall risk: (OR=5.86, 95% CI 3.60–9.54)3 months: OR=7.58 (95% CI 4.27–13.45)6 months: OR=5.18 (95% CI 3.24–8.26)12 months: OR=6.37 (95% CI 2.63–15.40)24-36 months: OR=3.85 (95% CI 2.95–5.02);Risk factors for PI-IBS vs non PI-IBS: younger age, greater anxiety and depression | 1a |
| Schwille-Kiuntke et al.,Z Gastroenterol, 201165 | Germany | Systematic review | Subjects exposed to acute diarrhea (epidemics, individual GE, traveler's diarrhea)Manning, Rome I, II IBS | 6,404(2,414; 3,764;226)811 | Incidence, prevalence of PI-IBS at 12 months | Incidence,post-epidemics: 7-32%;post-individual GE: 4-36%;post-traveler's diarrhea: 4-14%;prevalence: 7-32% | 1a |
| Dai et al.,Hepatogastro-enterology, 201266 | China | Systematic review of case-control studies | Rome, Manning IBSin subjects exposed to bacterial GEvsnon-exposed | 2,721vs586,297 | Incidence of PI-IBS,risk factors | Global: OR=6.03 (95% CI 3.58-10.13);3 months: OR=8.47 (95% CI 4.85-14.76);6 months: OR=4.58 (95% CI 2.94-7.14);12 months: OR=6.19 (95% CI 2.82-13.58);24-36 months: OR=4.05 (95% CI 3.13-5.24); risk factors: female sex, younger age, severity of initial insult, enteritis duration, adverse psychological factors | 3a |
| Haagsma et al.,Epidemiol Infect,201067 | Hollan-d | Case-control outcome | Rome, ManningIBSin subjects exposed to bacteriavsCampylobactervsSalmonellavsShigellavscontrols | 318vs108vs266vs322vs585,178 | Incidence of PI- IBS at 1 year post GE,AR at 10-12 months | Incidence: 4-17%;AR: 8.8% (90%CI 7.2-10.4) | 2b-c |
| Okhuysen et al.,Am J Gastroenterol,200480 | USA | Cohortstudy | Rome IIIBS,traveler's diarrhea fromenteropathogenic and enterotoxigenicE. coliin Mexico | 169 | Incidence PI-IBS at 6 months | 10% | 2b |
| Moss-Morris et al.,Psychosom Med,200681 | New Zealand | Cohort study | Rome I, IIIBSin subjects exposed to GE from Campylobactervsinfectious mononucleosis | 592vs243 | Risk for PI-IBS after 3 and 6 months | Risk for PI-IBS:Campylobacter > Mononucleosis,3 months: OR=3.45 (95% CI 1.75-667)6 months: OR=2.22 (95% CI 1.11-6.67) | 2b |
| Törnblom et al.,Clin Gastroenterol Hepatol,200784 | Sweden | Cohort study | Rome II IBS in subjects exposed to bacterial, viral, and parasitic GE | 333 | Prevalence of PI-IBS, risk factors | Prevalence of GI symptoms,3 months: 12%;5 years: 9% (68% IBS);risk factors: female sex, OR=2.65 (95% CI 1.28-5.50); antibiotic use, OR=2.37 (95% CI 1.07-5.25) | 2b |
| Marshall et al.,Clin Gastroenterol Hepatol,200785 | Canada | Cohort study | Rome I IBS in subjects exposed to GE due to Norovirus | 135 | Incidence PI-IBS after 3 months, risk factors | Incidence in exposed subjects: 23.6% vs non-exposed: 3.4% (OR 6.9, 95% CI 1.0–48.7, p=0.014);Risk factor: Vomiting during the GE,OR=10.5 (95% CI 1.3-85.5, p=0.028) | 2b |
| Thabane et al.,Am J Gastroenterol,201071 | Canada | Cohort study | Rome I IBS in children exposed toE. coli 0157:H7, Campylobacter spp | 467 | Incidence of PI-IBS | Exposed subjects: 10.5 vs non-exposed: 2.5%, OR=4.6 (95% CI 1.6-13.3) | 2b |
| Pitzurra et al.,J Travel Med, 201172 | Switzerland | Cohort study | Rome III IBS | 2,476 | Incidence of PI-IBS in Europeans traveling to destinations with limited resources | IBS: 1.0% (95% CI 0.6-1.4)PI-IBS: 2.8% (95% CI 1.7-3.9)Unselected IBS: 0.9% (95% CI 0.5-1.4);Risk factors 6 months after travel:traveler's diarrhea OR=3.61 (95% CI 1.74–7.51); adverse life events 1 year prior to travel, OR=2.58 (95% CI 1.09-6.07); diarrhea 4 months before travel OR=2.5 (95% CI 1.19–5.24) | 2b |
| Thabane et al.,Am J Gastroenterol,200910 | Canada | Cohort study | Nonspecified PI-IBS criteria in subjects exposed to GE from E. coli 0157:H7, C. jejuni and othersvsnon-exposed | 1,368vs701 | To determine and validate PI-IBS predictive factors | Predictors: female sex, age < 60, longer duration of diarrhea, more frequent bowel movements, abdominal colic, bloody stools, weight loss, fever, psychological alterations (anxiety and depression), OR=1.05 (95% CI 1.03-1.06, p < 0.0001); these factors derive from a numerical scale that determines low moderate to high risk for PI-IBS | 1b |
| Schwille-Kiuntke et al.,Neurogastroenterol Motil,201182 | Germany | Cohort study | Rome III IBSin GE from SalmonellavsCampylobacter | 223vs249 | Prevalence of PI-IBS, moderate to severe cases | Prevalence, S. enteritidis: 8.1% vs C. jejuni: 12.8%; severe PI-IBS, Salmonella > Campylobacter: X2=3.984, p=0.047;risk factors for IBS, Salmonella > Campylobacter: female sex, younger age | 2b |
| Villani et al.,Gastro-enterology,201076 | Canada | Case-control study within a cohort study | Rome I IBS in subjects exposed toGEvsExposed subjects without IBS | 228vs581 | To establish genetic variants associated with PI-IBS susceptibility | CDH1, tight junction protein promoters (rs16260, -C160A, p=0.0352); IL6, cytokine (rs1800795, -G174C, p=0.0420);TLR9, innate immune receptor (rs352139, P545P, p=0.0059) and (rs5743836, -T1237C; p=0 .0250) | 2a |
| Ji et al.,J Gastroen-terol Hepatol,200567 | South Korea | Case-control study within a cohort study | Rome I, II IBS in subjects exposed toShigellavsnon-exposed | 101vs102 | Incidence of PI-IBS after 12 months, risk factors | Incidence in exposed subjects: 14.85% vs non-exposed: 5.88, OR=2.9 (95% CI 1.1-7.9);Independent risk factor: diarrhea | 2b |
| Marshall et al.,Gut,201070 | Canada | Case-control study with a cohort study | Rome I IBS in subjects exposed to GE due toE. coli 0157:H7 and C. jejunivsnon-exposedsubjects | 742vs424 | Prevalence of PI-IBS,risk factors | Prevalence,2-3 years: 28.3% vs 8 years: 15.4%;risk in exposed subjects vs non-exposed OR=3.12 (95% CI 1.99-5.04);independent risk factors at 8 years: female sex, younger age, previous anxiety/depression, fever, weight loss during the acute infection | 2b |
| Kim et al.,Korean J Gastroenterol,200677 | South Korea | Case-control study within a cohort study | Rome II IBS in subjects exposed toShigella sppvsnon-exposed | 95vs105 | PI-IBS at 3 years | Incidence,1 year: 13.8% vs 1.1% OR=11.9 (95% CI 1.49-95.58);3 years: 14.9% vs 4.5% OR=3.93 (95% CI 1.20-12.86);recovery from PI-IBS at 3 years: 25% | 2b |
| Morgan et al.,Gastroen-terol Res Pract,201273 | Nicara-gua | Case-control study within a cohort study | Rome II IBS | 163vs194 | Prevalence of IBS in accordance with parasite burden | With parasitosis: 16.6% vs controls: 15.4%, (p=NS);IBS-D: 25%, IBS-C: 32%, IBS-M: 43% | 2b |
| Zanini et al.,Am J Gastroenterol,201275 | Italy | Case-control study within a cohort study | Rome III IBS,in subjects exposed to norovirusvsnon-exposed | 186vs198 | Incidence of PI-IBS after 1 year | Exposed subjects: 21.5% vs non-exposed: 1.5%, OR=11.40 (95% CI 3.44-37.82), p<0.0001;IBS-C: 10%, IBS-D: 17.5%, IBS-M: 40%, IBS-U: 32.5% | 2b |
| Soyturk et al.,Am J Gastroenterol, 200783 | Turkey | Case-control study within a cohort study | Rome II IBSin subjects exposed to GE from Trichinella britovivsnon-exposed | 72vs27 | Incidence of PI-IBS at 2 months, persistence and symptoms at 4, 6, and 12 months | Incidence at 2 months in exposed subjects: 13.9% vs non-exposed: 0; persistence,4 months: 13.9%; 6 months: 13.9%; 12 months: 7% | 2b |
| DuPont et al.,Am J Trop Med Hyg,201069 | USA | Case-control | Rome II IBSPI, non PI(after acute symptom presentation)a | 221 | Prevalence of PI-IBS and non PI-IBS, history of traveler's diarrhea in IBS | Prevalence,PI-IBS: 11.4% vs non PI-IBS: 24.9%traveler's diarrhea,PI-IBS: 14.0% vs non PI-IBS: 4.5, (p=0.006) | 3b |
| Porter et al.,Dig Dis Sci, 201178 | USA | Case-control | FGIDICD-9 564.1in soldiers deployed in Afghanistanvsdeployed soldiers without FGID | 129vs396 | Prevalence of diarrhea, to determine whether diarrhea, vomiting, and war-related stressors were risk factors for PI- IBS | Prevalence of IBS: 17%;risk factors,diarrhea: OR=5.27 (95% CI 2.28-12.21, p<0.001);vomiting: OR=7.00 (95% CI 2.70-18.14, p<0.001)stress: OR=2.30 (1.06-4.96, p<0.05) | 3b |
| Wensaas et al.,Gut,201274 | Norway | Case-control | Rome III IBS in subjects exposed to giardiasisvsnon-exposed | 817vs1,128 | Prevalence of PI-IBS vs non PI-IBS after 3 years | PI-IBS: 46.1% vs non PI-IBS: 14% RR=3.4 (95% CI 2.9-3.8) | 3b |
| Rodríguez-Fandiño et al.,Neurogas-troenterol Motil,201379 | Mexico | Case-control study within an experimental study | Rome IIIBSSpiller PI-IBS questionnaire | 20 | Prevalence of PI-IBS | 5.0% | 3b |
The studies are organized from higher to lower level of evidence and then in the progressive order of the year of publication.
AR: attributable risk; C: constipation; CDH1: cadherin 1; D: diarrhea; FGID: functional gastrointestinal disorder; GE: gastroenteritis; IBS: irritable bowel syndrome; LE: level of evidence; M: mixed; 95% CI: 95% confidence interval; N: number; NS: not significant; OR: odds ratio; PBMC: peripheral blood mononuclear cells; PI: post-infectious; RR: relative risk; spp: species; TLR9: Toll-like receptor 9; U: unclassifiable.
The incidence of clinical symptoms of IBS after a gastrointestinal infection has been reported at an average of 9-10% based on 2 systematic reviews, but varies depending on the case from 4 to 36%.65,67 There are no differences if IBS develops after an acute gastroenteritis episode during epidemics, due to isolated infections, or after traveler's diarrhea.65 Likewise, the probability of developing IBS is 6 times higher in subjects that have been exposed to gastrointestinal infections than in those that have not.66
The prevalence of PI-IBS has been reported in 7 to 33% of patients, but there are wide variations depending on the reported series and particularly on the time of observation.65 Prevalence also varies depending on the geographic region and Mexico appears to have one of the lowest prevalence rates in the world, at only 5.0%.79 Prevalence is also higher if it is evaluated sooner rather than later after an infectious outbreak. For example, 2 years after an outbreak of bacterial gastroenteritis in Walkerton (Canada), PI-IBS prevalence was reported in 30.4% of the subjects exposed to acute gastroenteritis.87 Contrastingly, in the following years the prevalence had decreased and at 8 years it was 15.4%.70,88 Similarly, in Sweden the initial PI-IBS prevalence of 12% was reduced to 9%, 5 years later.84 In large reviews it has been reported that the probability (odds ratio: OR) of developing IBS 3 months after an episode of infectious diarrhea was 7.58-8.47 times higher than in the control population, but at 24 to 36 months the OR had descended to 3.85-4.05.10,66
Regarding the causal agent of PI-IBS, the studies on incidence and prevalence generally refer to clinical presentations of IBS after bacterial infections or the cause is not specified. The most frequently identified bacteria have been E. coli, Campylobacter, Shigella, and Salmonella.10,67,68,77,80E. coli was the cause in the majority of the patients presenting with PI-IBS after an episode of traveler's diarrhea acquired in Mexico.80 In a group of patients in Houston (Texas) 16.1% of the patients with PI-IBS had previously travelled abroad, whereas only 7.5% of the patients with non PI-IBS had done so.69 A study conducted on children reported PI-IBS in 10.5% after Campylobacter infection, compared with IBS in 2.5% of the children that were not exposed.71 On the other hand, bacterial gastroenteritis due to Campylobacter is followed by IBS more frequently than by infectious diseases that do not affect the digestive tract, such as infectious mononucleosis, for example.81 With respect to gastroenteritis of viral etiology, Norovirus has been described as causing PI-IBS; the results of the 2 published studies on this75,85 coincide, reporting that 21.5 and 23.6% of the patients had PI-IBS, whereas only 1.5 and 4.4% of the controls had IBS. In relation to the role of intestinal parasites, the results are less conclusive. A Central American study found no differences in IBS prevalence according to the Rome II criteria in individuals with a history of parasitosis vs subjects with no such history (16.6% vs 15.4%).73 On the other hand, after a giardiasis outbreak that infected a large number of Norwegians, the prevalence of IBS according to the Rome III criteria was noticeably higher than in the control population (46 vs 14%).74 Likewise, in an outbreak of Trichinella britovi in Turkey that resulted in 72 cases of infection, 10 developed IBS (13.9%).83
In reference to the risk factors for developing PI-IBS, the female sex, the severity of gastroenteritis, and the presence of anxiety and depression have been described.10 Villani et al. analyzed the subjects that developed PI-IBS 2 to 3 years after the Walkerton epidemic, and found that genetic variations associated with the expression of the Toll-like receptor (TLR)-9 related to innate immunity, interleukin (IL)-6 associated with immune activation, and cadherin-1 (CDH1) involved in tight epithelial junctions, were independent risk factors for PI-IBS. 76
The above allows us to conclude that the incidence and prevalence of PI-IBS are variable and even though the bacterial etiology has been studied the most, it appears that viruses such as the Norovirus and parasites such as Giardia may also be related to PI-IBS. In addition, risk factors such as the female sex, severity of gastroenteritis, and previous anxiety and depression, as well as genetic factors associated with immunity, have been determined.
3.44. Low-grade intestinal inflammation related to post-infectious and non-post-infectious irritable bowel syndrome- •
There is evidence that suggests the presence of low-grade intestinal inflammation in a subgroup of IBS patients, which involves an increase in intraepithelial T lymphocytes (IEL), mast cells and enterochromaffin cells (level 3 a evidence, grade B recommendation).
- •
The increase in IEL and mast cells appears to be more commonly observed in patients with IBS-D, compared with IBS-C and IBS-M; however, whether there are differences between PI-IBS and non PI-IBS cannot be concluded (level 3 a-b evidence, grade B recommendation).
- •
There is insufficient evidence to determine whether there are differences in the enterochromaffin cells between PI-IBS and non PI-IBS (level 5 evidence, grade D recommendation).
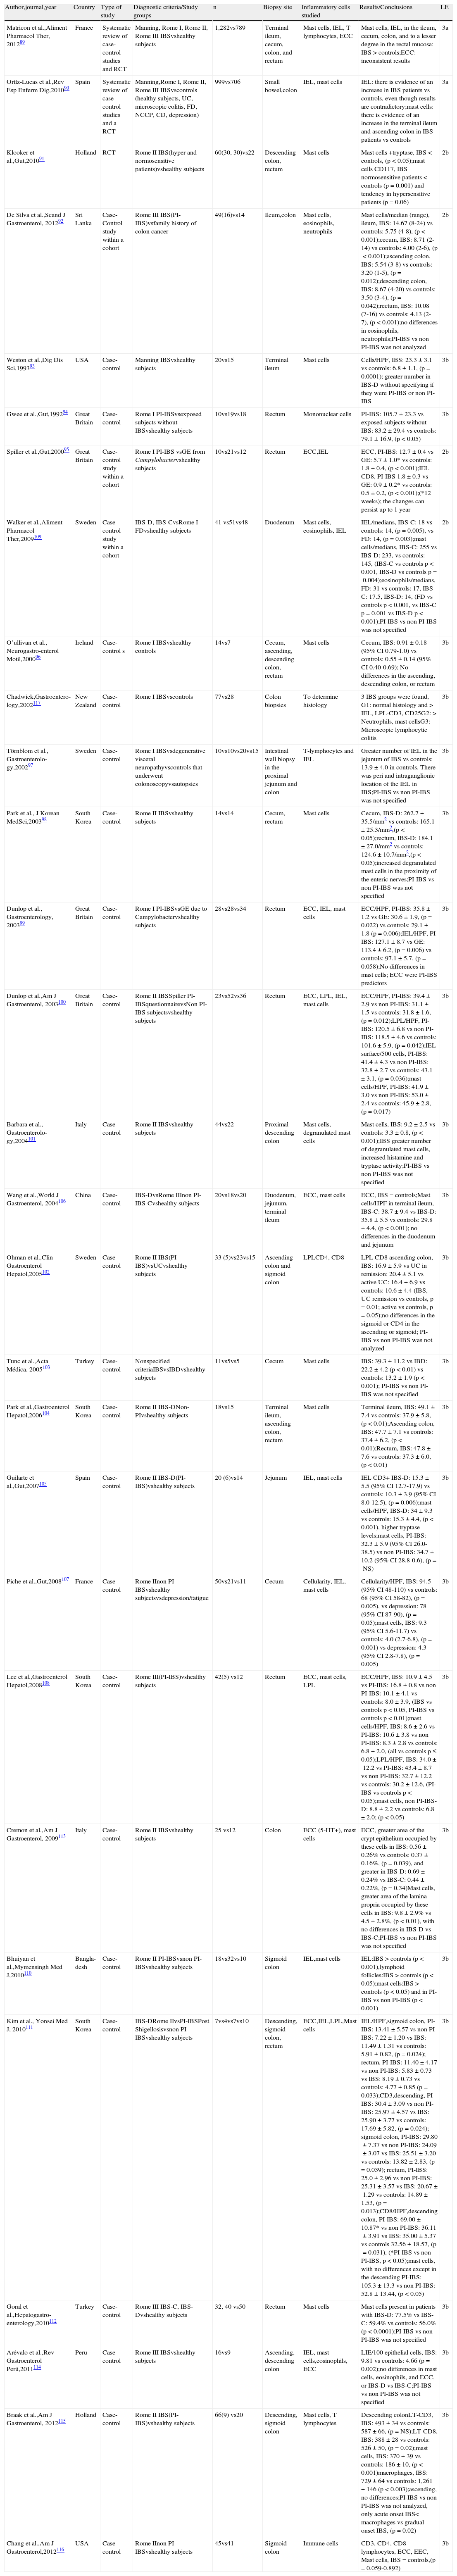
A total of 29 articles were identified; 2 were systematic reviews 89,90 and the rest were original ones.91–117 Twenty-seven studies were identified in the initial search90–115,117 and 2 89,116 were later selected from other sources. All the studies were conducted on adult population, with the exception of one on pediatric population. Twenty-four studies analyzed the presence of chronic inflammatory cells (T lymphocytes, mast cells, and enterochromaffin cells) in the mucosa of the colon and rectum in IBS patients and controls89,91,94–104,107–108,110–118 (Table 5).
Low-grade inflammation in PI-IBS and non PI-IBS.
| Author,journal,year | Country | Type of study | Diagnostic criteria/Study groups | n | Biopsy site | Inflammatory cells studied | Results/Conclusions | LE |
| Matricon et al.,Aliment Pharmacol Ther, 201289 | France | Systematic review of case-control studies and RCT | Manning, Rome I, Rome II, Rome III IBSvshealthy subjects | 1,282vs789 | Terminal ileum, cecum, colon, and rectum | Mast cells, IEL, T lymphocytes, ECC | Mast cells, IEL, in the ileum, cecum, colon, and to a lesser degree in the rectal mucosa: IBS > controls;ECC: inconsistent results | 3a |
| Ortíz-Lucas et al.,Rev Esp Enferm Dig,201090 | Spain | Systematic review of case-control studies and a RCT | Manning,Rome I, Rome II, Rome III IBSvscontrols (healthy subjects, UC, microscopic colitis, FD, NCCP, CD, depression) | 999vs706 | Small bowel,colon | IEL, mast cells | IEL: there is evidence of an increase in IBS patients vs controls, even though results are contradictory;mast cells: there is evidence of an increase in the terminal ileum and ascending colon in IBS patients vs controls | 3a |
| Klooker et al.,Gut,201091 | Holland | RCT | Rome II IBS(hyper and normosensitive patients)vshealthy subjects | 60(30, 30)vs22 | Descending colon, rectum | Mast cells | Mast cells +tryptase, IBS<controls, (p<0.05);mast cells CD117, IBS normosensitive patients<controls (p=0.001) and tendency in hypersensitive patients (p=0.06) | 2b |
| De Silva et al.,Scand J Gastroenterol, 201292 | Sri Lanka | Case- Control study within a cohort | Rome III IBS(PI-IBS)vsfamily history of colon cancer | 49(16)vs14 | Ileum,colon | Mast cells, eosinophils, neutrophils | Mast cells/median (range), ileum, IBS: 14.67 (8-24) vs controls: 5.75 (4-8), (p<0.001);cecum, IBS: 8.71 (2-14) vs controls: 4.00 (2-6), (p<0.001);ascending colon, IBS: 5.54 (3-8) vs controls: 3.20 (1-5), (p=0.012);descending colon, IBS: 8.67 (4-20) vs controls: 3.50 (3-4), (p=0.042);rectum, IBS: 10.08 (7-16) vs controls: 4.13 (2-7), (p<0.001);no differences in eosinophils, neutrophils;PI-IBS vs non PI-IBS was not analyzed | 2b |
| Weston et al.,Dig Dis Sci,199393 | USA | Case-control | Manning IBSvshealthy subjects | 20vs15 | Terminal ileum | Mast cells | Cells/HPF, IBS: 23.3±3.1 vs controls: 6.8±1.1, (p=0.0001); greater number in IBS-D without specifying if they were PI-IBS or non PI-IBS | 3b |
| Gwee et al.,Gut,199294 | Great Britain | Case-control | Rome I PI-IBSvsexposed subjects without IBSvshealthy subjects | 10vs19vs18 | Rectum | Mononuclear cells | PI-IBS: 105.7±23.3 vs exposed subjects without IBS: 83.2±29.4 vs controls: 79.1±16.9, (p<0.05) | 3b |
| Spiller et al.,Gut,200095 | Great Britain | Case-control study within a cohort | Rome I PI-IBS vsGE from Campylobactervshealthy subjects | 10vs21vs12 | Rectum | ECC,IEL | ECC, PI-IBS: 12.7±0.4 vs GE: 5.7±1.0* vs controls: 1.8±0.4, (p<0.001);IEL CD8, PI-IBS 1.8±0.3 vs GE: 0.9±0.2* vs controls: 0.5±0.2, (p<0.001);(*12 weeks); the changes can persist up to 1 year | 2b |
| Walker et al.,Aliment Pharmacol Ther,2009109 | Sweden | Case-control study within a cohort | IBS-D, IBS-CvsRome I FDvshealthy subjects | 41 vs51vs48 | Duodenum | Mast cells, eosinophils, IEL | IEL/medians, IBS-C: 18 vs controls: 14, (p=0.005), vs FD: 14, (p=0.003);mast cells/medians, IBS-C: 255 vs IBS-D: 233, vs controls: 145, (IBS-C vs controls p<0.001, IBS-D vs controls p=0.004);eosinophils/medians, FD: 31 vs controls: 17, IBS-C: 17.5, IBS-D: 14, (FD vs controls p<0.001, vs IBS-C p=0.001 vs IBS-D p<0.001);PI-IBS vs non PI-IBS was not specified | 2b |
| O’ullivan et al., Neurogastro-enterol Motil,200096 | Ireland | Case-control s | Rome I IBSvshealthy controls | 14vs7 | Cecum, ascending, descending colon, rectum | Mast cells | Cecum, IBS: 0.91±0.18 (95% CI 0.79-1.0) vs controls: 0.55±0.14 (95% CI 0.40-0.69); No differences in the ascending, descending colon, or rectum | 3b |
| Chadwick,Gastroentero-logy,2002117 | New Zealand | Case-control | Rome I IBSvscontrols | 77vs28 | Colon biopsies | To determine histology | 3 IBS groups were found, G1: normal histology and > IEL, LPL-CD3, CD25G2: > Neutrophils, mast cellsG3: Microscopic lymphocytic colitis | 3b |
| Törnblom et al., Gastroenterolo-gy,200297 | Sweden | Case-control | Rome I IBSvsdegenerative visceral neuropathyvscontrols that underwent colonoscopyvsautopsies | 10vs10vs20vs15 | Intestinal wall biopsy in the proximal jejunum and colon | T-lymphocytes and IEL | Greater number of IEL in the jejunum of IBS vs controls: 13.9±4.0 in controls. There was peri and intraganglionic location of the IEL in IBS;PI-IBS vs non PI-IBS was not specified | 3b |
| Park et al., J Korean MedSci,200398 | South Korea | Case-control | Rome II IBSvshealthy subjects | 14vs14 | Cecum, rectum | Mast cells | Cecum, IBS-D: 262.7±35.5/mm2 vs controls: 165.1±25.3/mm2,(p<0.05);rectum, IBS-D: 184.1±27.0/mm2 vs controls: 124.6±10.7/mm2,(p<0.05);increased degranulated mast cells in the proximity of the enteric nerves;PI-IBS vs non PI-IBS was not specified | 3b |
| Dunlop et al., Gastroenterology, 200399 | Great Britain | Case-control | Rome I PI-IBSvsGE due to Campylobactervshealthy subjects | 28vs28vs34 | Rectum | ECC, IEL, mast cells | ECC/HPF, PI-IBS: 35.8±1.2 vs GE: 30.6±1.9, (p=0.022) vs controls: 29.1±1.8 (p=0.006);IEL/HPF, PI-IBS: 127.1±8.7 vs GE: 113.4±6.2, (p=0.006) vs controls: 97.1±5.7, (p=0.058);No differences in mast cells; ECC were PI-IBS predictors | 3b |
| Dunlop et al.,Am J Gastroenterol, 2003100 | Great Britain | Case-control | Rome II IBSSpiller PI-IBSquestionnairevsNon PI-IBS subjectsvshealthy subjects | 23vs52vs36 | Rectum | ECC, LPL, IEL, mast cells | ECC/HPF, PI-IBS: 39.4±2.9 vs non PI-IBS: 31.1±1.5 vs controls: 31.8±1.6, (p=0.012);LPL/HPF, PI-IBS: 120.5±6.8 vs non PI-IBS: 118.5±4.6 vs controls: 101.6±5.9, (p=0.042);IEL surface/500 cells, PI-IBS: 41.4±4.3 vs non PI-IBS: 32.8±2.7 vs controls: 43.1±3.1, (p=0.036);mast cells/HPF, PI-IBS: 41.9±3.0 vs non PI-IBS: 53.0±2.4 vs controls: 45.9±2.8, (p=0.017) | 3b |
| Barbara et al., Gastroenterolo-gy,2004101 | Italy | Case-control | Rome II IBSvshealthy subjects | 44vs22 | Proximal descending colon | Mast cells, degranulated mast cells | Mast cells, IBS: 9.2±2.5 vs controls: 3.3±0.8, (p<0.001);IBS greater number of degranulated mast cells, increased histamine and tryptase activity;PI-IBS vs non PI-IBS was not specified | 3b |
| Wang et al.,World J Gastroenterol, 2004106 | China | Case-control | IBS-DvsRome IIInon PI-IBS-Cvshealthy subjects | 20vs18vs20 | Duodenum, jejunum, terminal ileum | ECC, mast cells | ECC, IBS=controls;Mast cells/HPF in terminal ileum, IBS-C: 38.7±9.4 vs IBS-D: 35.8±5.5 vs controls: 29.8±4.4, (p<0.001); no differences in the duodenum and jejunum | 3b |
| Ohman et al.,Clin Gastroenterol Hepatol,2005102 | Sweden | Case-control | Rome II IBS(PI-IBS)vsUCvshealthy subjects | 33 (5)vs23vs15 | Ascending colon and sigmoid colon | LPLCD4, CD8 | LPL CD8 ascending colon, IBS: 16.9±5.9 vs UC in remission: 20.4±5.1 vs active UC: 16.4±6.9 vs controls: 10.6±4.4 (IBS, UC remission vs controls, p=0.01; active vs controls, p=0.05);no differences in the sigmoid or CD4 in the ascending or sigmoid; PI-IBS vs non PI-IBS was not analyzed | 3b |
| Tunc et al.,Acta Médica, 2005103 | Turkey | Case-control | Nonspecified criteriaIBSvsIBDvshealthy subjects | 11vs5vs5 | Cecum | Mast cells | IBS: 39.3±11.2 vs IBD: 22.2±4.2 (p<0.01) vs controls: 13.2±1.9 (p<0.001); PI-IBS vs non PI-IBS was not specified | 3b |
| Park et al.,Gastroenterol Hepatol,2006104 | South Korea | Case-control | Rome II IBS-DNon-PIvshealthy subjects | 18vs15 | Terminal ileum, ascending colon, rectum | Mast cells | Terminal ileum, IBS: 49.1±7.4 vs controls: 37.9±5.8, (p<0.01);Ascending colon, IBS: 47.7±7.1 vs controls: 37.4±6.2, (p<0.01);Rectum, IBS: 47.8±7.6 vs controls: 37.3±6.0, (p<0.01) | 3b |
| Guilarte et al.,Gut,2007105 | Spain | Case-control | Rome II IBS-D(PI-IBS)vshealthy subjects | 20 (6)vs14 | Jejunum | IEL, mast cells | IEL CD3+ IBS-D: 15.3±5.5 (95% CI 12.7-17.9) vs controls: 10.3±3.9 (95% CI 8.0-12.5), (p=0.006);mast cells/HPF, IBS-D: 34±9.3 vs controls: 15.3±4.4, (p<0.001), higher tryptase levels;mast cells, PI-IBS: 32.3±5.9 (95% CI 26.0-38.5) vs non PI-IBS: 34.7±10.2 (95% CI 28.8-0.6), (p=NS) | 3b |
| Piche et al.,Gut,2008107 | France | Case-control | Rome IInon PI-IBSvshealthy subjectsvsdepression/fatigue | 50vs21vs11 | Cecum | Cellularity, IEL, mast cells | Cellularity/HPF, IBS: 94.5 (95% CI 48-110) vs controls: 68 (95% CI 58-82), (p=0.005), vs depression: 78 (95% CI 87-90), (p=0.05);mast cells, IBS: 9.3 (95% CI 5.6-11.7) vs controls: 4.0 (2.7-6.8), (p=0.001) vs depression: 4.3 (95% CI 2.8-7.8), (p=0.005) | 3b |
| Lee et al.,Gastroenterol Hepatol,2008108 | South Korea | Case-control | Rome III(PI-IBS)vshealthy subjects | 42(5) vs12 | Rectum | ECC, mast cells, LPL | ECC/HPF, IBS: 10.9±4.5 vs PI-IBS: 16.8±0.8 vs non PI-IBS: 10.1±4.1 vs controls: 8.0±3.9, (IBS vs controls p<0.05, PI-IBS vs controls p<0.01);mast cells/HPF, IBS: 8.6±2.6 vs PI-IBS: 10.6±3.8 vs non PI-IBS: 8.3±2.8 vs controls: 6.8±2.0, (all vs controls p ≤ 0.05);LPL/HPF, IBS: 34.0±12.2 vs PI-IBS: 43.4±8.7 vs non PI-IBS: 32.7±12.2 vs controls: 30.2±12.6, (PI-IBS vs controls p<0.05);mast cells, non PI-IBS-D: 8.8±2.2 vs controls: 6.8±2.0; (p<0.05) | 3b |
| Cremon et al.,Am J Gastroenterol, 2009113 | Italy | Case-control | Rome II IBSvshealthy subjects | 25 vs12 | Colon | ECC (5-HT+), mast cells | ECC, greater area of the crypt epithelium occupied by these cells in IBS: 0.56±0.26% vs controls: 0.37±0.16%, (p=0.039), and greater in IBS-D: 0.69±0.24% vs IBS-C: 0.44±0.22%, (p=0.34)Mast cells, greater area of the lamina propria occupied by these cells in IBS: 9.8±2.9% vs 4.5±2.8%, (p<0.01), with no differences in IBS-D vs IBS-C;PI-IBS vs non PI-IBS was not specified | 3b |
| Bhuiyan et al.,Mymensingh Med J,2010110 | Bangla-desh | Case-control | Rome II PI-IBSvsnon PI-IBSvshealthy subjects | 18vs32vs10 | Sigmoid colon | IEL,mast cells | IEL:IBS > controls (p<0.001),lymphoid follicles:IBS > controls (p<0.05);mast cells:IBS > controls (p<0.05) and in PI-IBS vs non PI-IBS (p<0.001) | 3b |
| Kim et al., Yonsei Med J, 2010111 | South Korea | Case-control | IBS-DRome IIvsPI-IBSPost Shigellosisvsnon PI-IBSvshealthy subjects | 7vs4vs7vs10 | Descending, sigmoid colon, rectum | ECC,IEL,LPL,Mast cells | IEL/HPF,sigmoid colon, PI-IBS: 13.41±5.57 vs non PI-IBS: 7.22±1.20 vs IBS: 11.49±1.31 vs controls: 5.91±0.82, (p=0.024); rectum, PI-IBS: 11.40±4.17 vs non PI-IBS: 5.83±0.73 vs IBS: 8.19±0.73 vs controls: 4.77±0.85 (p=0.033);CD3,descending, PI-IBS: 30.4±3.09 vs non PI-IBS: 25.97±4.57 vs IBS: 25.90±3.77 vs controls: 17.69±5.82, (p=0.024); sigmoid colon, PI-IBS: 29.80±7.37 vs non PI-IBS: 24.09±3.07 vs IBS: 25.51±3.20 vs controls: 13.82±2.83, (p=0.039); rectum, PI-IBS: 25.0±2.96 vs non PI-IBS: 25.31±3.57 vs IBS: 20.67±1.29 vs controls: 14.89±1.53, (p=0.013);CD8/HPF,descending colon, PI-IBS: 69.00±10.87* vs non PI-IBS: 36.11±3.91 vs IBS: 35.00±5.37 vs controls 32.56±18.57, (p=0.031), (*PI-IBS vs non PI-IBS, p<0.05);mast cells, with no differences except in the descending PI-IBS: 105.3±13.3 vs non PI-IBS: 52.8±13.44, (p<0.05) | 3b |
| Goral et al.,Hepatogastro-enterology,2010112 | Turkey | Case-control | Rome III IBS-C, IBS-Dvshealthy subjects | 32, 40 vs50 | Rectum | Mast cells | Mast cells present in patients with IBS-D: 77.5% vs IBS-C: 59.4% vs controls: 56.0% (p<0.0001);PI-IBS vs non PI-IBS was not specified | 3b |
| Arévalo et al.,Rev Gastroenterol Perú,2011114 | Peru | Case-control | Rome III IBSvshealthy subjects | 16vs9 | Ascending, descending colon | IEL, mast cells,eosinophils, ECC | LIE/100 epithelial cells, IBS: 9.81 vs controls: 4.66 (p=0.002);no differences in mast cells, eosinophils, and ECC, or IBS-D vs IBS-C;PI-IBS vs non PI-IBS was not specified | 3b |
| Braak et al.,Am J Gastroenterol, 2012115 | Holland | Case-control | Rome II IBS(PI-IBS)vshealthy subjects | 66(9) vs20 | Descending, sigmoid colon | Mast cells, T lymphocytes | Descending colonLT-CD3, IBS: 493±34 vs controls: 587±66, (p=NS);LT-CD8, IBS: 388±28 vs controls: 526±50, (p=0.02);mast cells, IBS: 370±39 vs controls: 186±10, (p<0.001)macrophages, IBS: 729±64 vs controls: 1,261±146 (p<0.003);ascending, no differences;PI-IBS vs non PI-IBS was not analyzed, only acute onset IBS< macrophages vs gradual onset IBS, (p=0.02) | 3b |
| Chang et al.,Am J Gastroenterol,2012116 | USA | Case-control | Rome IInon PI-IBSvshealthy subjects | 45vs41 | Sigmoid colon | Immune cells | CD3, CD4, CD8 lymphocytes, ECC, EEC, Mast cells, IBS=controls,(p=0.059-0.892) | 3b |
The studies are organized from higher to lower level of evidence and then in the progressive order of the year of publication. In regard to the Systematic Reviews, the country corresponds to that of the authors that conducted the study. In the diagnostic criteria/study groups and n columns the corresponding subgroup of those with IBS is in parentheses.
C: constipation; CD: celiac disease; D: diarrhea; ECC: enterochromaffin cells; FD: functional dyspepsia; GE: gastroenteritis; HPF: high power field; IEL: intraepithelial lymphocytes; IBD: inflammatory bowel disease; IBS: irritable bowel syndrome; LE: level of evidence; LPL: lamina propria lymphocytes; NCCP: noncardiac chest pain; Non PI: non-post-infectious; N: number; PI: post-infectious; RCT: randomized controlled trial; UC: ulcerative colitis.
For several years there have been reports on the increase in the number of enterochromaffin cells in rectal biopsies of PI-IBS patients.99–100,106 Spiller et al. reported an up to 5 times higher increase in the number of enterochromaffin cells positive for synaptophysin in patients with C. jejuni infection.95 A gradual decrease in the number of enterochromaffin cells was observed in these patients in biopsies taken 6 and 12 weeks after infection; however, one year after the acute infection in the subgroup of patients that remained symptomatic, that is, those with PI-IBS, the number of enterochromaffin cells remained elevated, in a range similar to that observed 2 weeks after the C. jejuni infection. The higher number of enterochromaffin cells may have pathophysiologic importance because these cells are the main source of serotonin (5-HT) storage in the organism and there is evidence of an increase in 5-HT release in IBS patients.119–120 The prokinetic and secretory effect of 5-HT may be related to the diarrhea or liquid stools that accompany IBS-D. A recent systematic review89 concluded that despite the fact that some researchers have observed an increase in the number of enterochromaffin cells and in the production of serotonin in the mucosa of the colon and rectum in IBS patients, compared with healthy controls, many others have not confirmed such findings. The results show that these changes are not consistent.
In addition, some studies have demonstrated a rise in the number of IEL in both IBS-D and PI-IBS, mainly after acute gastroenteritis due to C. jejuni or Shigella.95,111,117 Nevertheless, it is not completely known if there is also an increase in T lymphocytes in non PI-IBS. In fact, only 7 studies compare PI-IBS and non PI-IBS with respect to the inflammatory changes encountered through histology.92,94,99–100,108,110–111 Dunlop et al. found a higher number of enterochromaffin cells and IEL in PI-IBS than in non PI-IBS and the controls in 2 studies, and therefore suggest that they could be markers for PI-IBS.99–100 Likewise, Lee et al. observed a greater number of enterochromaffin cells, IEL, and mast cells in rectal biopsies in PI-IBS patients, compared with non PI-IBS patients and healthy controls.108 An increase in the number of mast cells in non PI-IBS was observed only in those patients with IBS-D, not in patients with IBS-C or IBS-M. The rise in the number of mast cells had been previously described by Weston et al. in biopsies of the terminal ileum in patients with IBS, compared with the control group, but no differentiation was made between PI-IBS and non PI-IBS.93 Other researchers later confirmed the increase in the number of these cells in IBS,96,98,101,106 mainly in the IBS-D subgroup, in the patients with PI-IBS, as well as in those with non PI-IBS. Furthermore, the mast cells95–96,98,101,106 appear to be near the sensory neurons, and there is a positive correlation with the severity and frequency of pain and/or abdominal discomfort when they are in closer proximity. 101
In contrast, Braak et al. reported a decrease in the IEL, macrophage, and mast cell count in the colonic mucosa in 66 patients with IBS, compared with 20 healthy controls.115 In that study, the difference between PI-IBS and non PI-IBS was not specifically analyzed, but rather the patients with acute and gradual IBS onset were compared, and a lower number of macrophages was observed in those with gradual IBS onset.115 It is likely that the sudden onset group corresponds to PI-IBS, but we cannot conclude that. Previously, another study by the same group in Holland not only found a lower number of mast cells in biopsies of the rectum and descending colon in IBS, but also reduced tryptase release, compared with the controls.91 Finally, Chang et al. found no differences in the number of immune cells in the colonic mucosa between patients with non PI-IBS and the controls.116
The above suggests that there is an increase in IEL, mast cells, and enterochromaffin cells in the intestinal mucosa in a group of patients with IBS that appears to be more frequent in those with IBS-D. However, it cannot be determined whether this low-grade inflammation is characteristic of PI-IBS or non PI-IBS.
3.55. Altered bowel function in irritable bowel syndrome related to post-infectious irritable bowel syndrome, SIBO and/or microbiota alterations- •
The evidence suggests that the differences in the composition of the microbiota in subjects with IBS are related to alterations in the visceral sensitivity and motility function of the gastrointestinal tract (level 1 b evidence, grade A recommendation).
- •
The presence of methanogenic microbiota is significantly associated with constipation predominant IBS (IBS-C) (level 3a evidence, grade B recommendation).
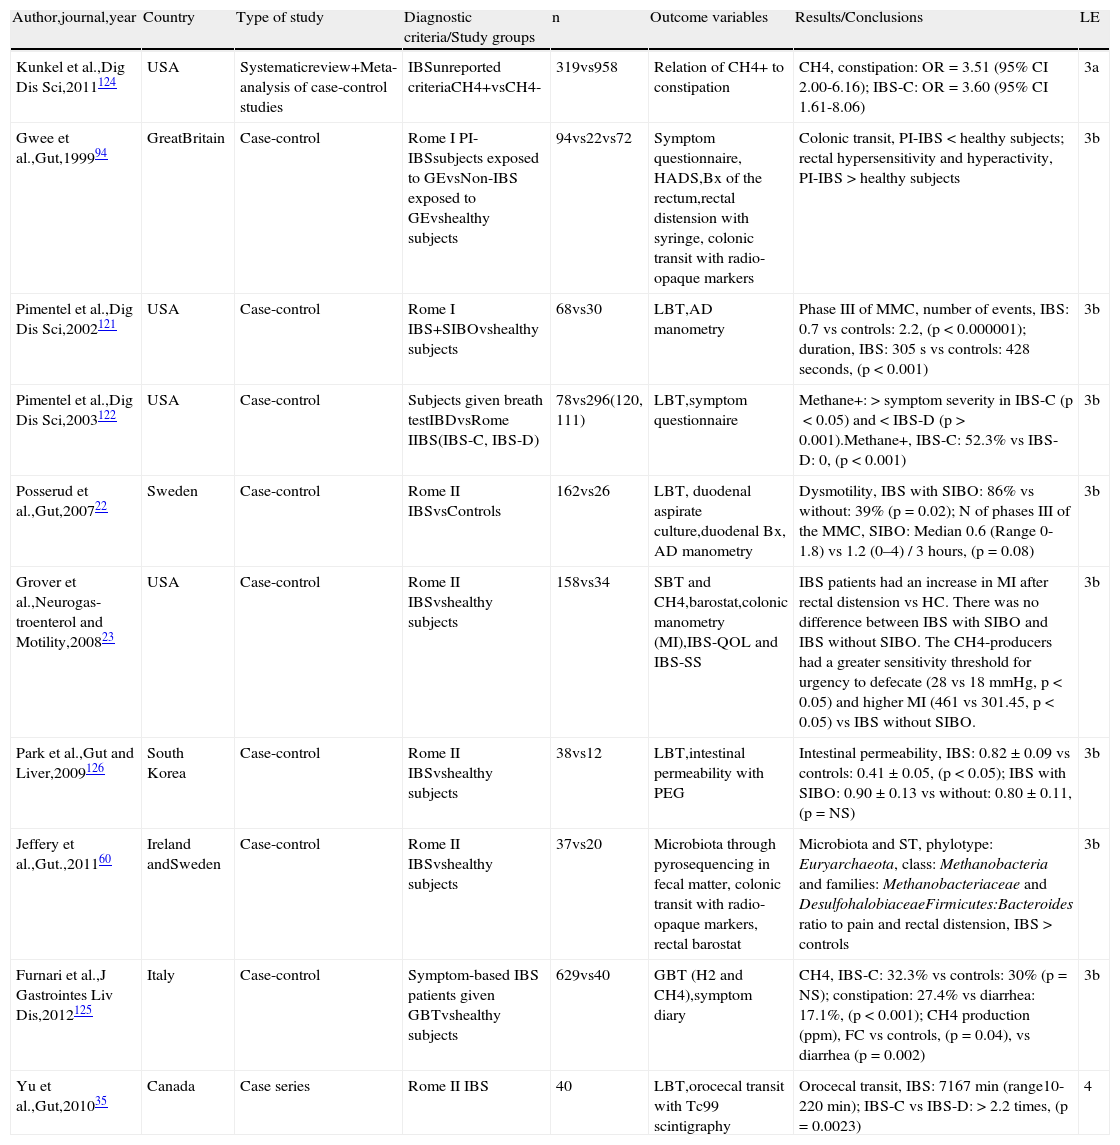
Eight articles related to bowel function22–23,35,60,94,121–123 were identified in the initial search and 3 additional articles104,124–125 were identified from other sources (Table 6). The evidence suggests that the changes in the microbiota of the patients with IBS have an influence on visceral sensitivity and gastrointestinal motility, especially at the antroduodenal and colorectal level.22–23,35,60,94,121–126 Regarding the sensory distubances, the studies have shown that some patients with IBS and dysbiosis (PI-IBS and IBS with SIBO) develop rectal hypersensitivity, one of the most characteristic pathophysiologic findings in IBS.94
Altered bowel physiology in relation to PI-IBS, SIBO, and microbiota alterations.
| Author,journal,year | Country | Type of study | Diagnostic criteria/Study groups | n | Outcome variables | Results/Conclusions | LE |
| Kunkel et al.,Dig Dis Sci,2011124 | USA | Systematicreview+Meta-analysis of case-control studies | IBSunreported criteriaCH4+vsCH4- | 319vs958 | Relation of CH4+ to constipation | CH4, constipation: OR=3.51 (95% CI 2.00-6.16); IBS-C: OR=3.60 (95% CI 1.61-8.06) | 3a |
| Gwee et al.,Gut,199994 | GreatBritain | Case-control | Rome I PI-IBSsubjects exposed to GEvsNon-IBS exposed to GEvshealthy subjects | 94vs22vs72 | Symptom questionnaire, HADS,Bx of the rectum,rectal distension with syringe, colonic transit with radio-opaque markers | Colonic transit, PI-IBS < healthy subjects; rectal hypersensitivity and hyperactivity, PI-IBS > healthy subjects | 3b |
| Pimentel et al.,Dig Dis Sci,2002121 | USA | Case-control | Rome I IBS+SIBOvshealthy subjects | 68vs30 | LBT,AD manometry | Phase III of MMC, number of events, IBS: 0.7 vs controls: 2.2, (p<0.000001); duration, IBS: 305 s vs controls: 428seconds, (p<0.001) | 3b |
| Pimentel et al.,Dig Dis Sci,2003122 | USA | Case-control | Subjects given breath testIBDvsRome IIBS(IBS-C, IBS-D) | 78vs296(120, 111) | LBT,symptom questionnaire | Methane+: > symptom severity in IBS-C (p<0.05) and < IBS-D (p > 0.001).Methane+, IBS-C: 52.3% vs IBS-D: 0, (p<0.001) | 3b |
| Posserud et al.,Gut,200722 | Sweden | Case-control | Rome II IBSvsControls | 162vs26 | LBT, duodenal aspirate culture,duodenal Bx, AD manometry | Dysmotility, IBS with SIBO: 86% vs without: 39% (p=0.02); N of phases III of the MMC, SIBO: Median 0.6 (Range 0-1.8) vs 1.2 (0–4) / 3hours, (p=0.08) | 3b |
| Grover et al.,Neurogas-troenterol and Motility,200823 | USA | Case-control | Rome II IBSvshealthy subjects | 158vs34 | SBT and CH4,barostat,colonic manometry (MI),IBS-QOL and IBS-SS | IBS patients had an increase in MI after rectal distension vs HC. There was no difference between IBS with SIBO and IBS without SIBO. The CH4-producers had a greater sensitivity threshold for urgency to defecate (28 vs 18mmHg, p<0.05) and higher MI (461 vs 301.45, p<0.05) vs IBS without SIBO. | 3b |
| Park et al.,Gut and Liver,2009126 | South Korea | Case-control | Rome II IBSvshealthy subjects | 38vs12 | LBT,intestinal permeability with PEG | Intestinal permeability, IBS: 0.82±0.09 vs controls: 0.41±0.05, (p<0.05); IBS with SIBO: 0.90±0.13 vs without: 0.80±0.11, (p=NS) | 3b |
| Jeffery et al.,Gut.,201160 | Ireland andSweden | Case-control | Rome II IBSvshealthy subjects | 37vs20 | Microbiota through pyrosequencing in fecal matter, colonic transit with radio-opaque markers, rectal barostat | Microbiota and ST, phylotype: Euryarchaeota, class: Methanobacteria and families: Methanobacteriaceae and DesulfohalobiaceaeFirmicutes:Bacteroides ratio to pain and rectal distension, IBS > controls | 3b |
| Furnari et al.,J Gastrointes Liv Dis,2012125 | Italy | Case-control | Symptom-based IBS patients given GBTvshealthy subjects | 629vs40 | GBT (H2 and CH4),symptom diary | CH4, IBS-C: 32.3% vs controls: 30% (p=NS); constipation: 27.4% vs diarrhea: 17.1%, (p<0.001); CH4 production (ppm), FC vs controls, (p=0.04), vs diarrhea (p=0.002) | 3b |
| Yu et al.,Gut,201035 | Canada | Case series | Rome II IBS | 40 | LBT,orocecal transit with Tc99 scintigraphy | Orocecal transit, IBS: 7167min (range10-220 min); IBS-C vs IBS-D: > 2.2 times, (p=0.0023) | 4 |
The studies are organized from higher to lower level of evidence and then in the progressive order of the year of publication.
AD: antroduodenal; C: constipation; CH4: methane; CI: confidence interval; D: diarrhea; FC: functional constipation; GBT: glucose breath test; HADS: hospital anxiety and depression scale; HC: healthy controls; H2: exhaled hydrogen; IBD: inflammatory bowel disease; IBS: irritable bowel syndrome; IBS-QOL: quality of life questionnaire for irritable bowel syndrome; IBS-SS: irritable bowel syndrome severity scale; LBT: lactulose breath test; MMC: migrating motor complex; MI: motility index; NS: not significant NT: normal transit; OR: odds ratio; PEG: polyethylene glycol; ppm: parts per million; SBT: sucrose breath test; SIBO: small intestinal bacterial overgrowth; ST: slow transit.
Various studies have also described that patients with PI-IBS have faster colonic transit time. For example, Gwee et al. demonstrated that subjects with a history of gastroenteritis and IBS had faster colonic transit than a control group of healthy subjects (median colonic transit time of 34.4 vs 55.2min, p=0.01).94 In contrast, Yu et al. found that the orocecal transit time correlated with the IBS subtype.35 Thus, orocecal transit is longer in patients with IBS-C than in those with IBS-D (p=0.0023).
Moreover, in patients with IBS and evidence of SIBO alterations in the number and frequency of phase III activities of the migrating motor complex (MMC) have been described.22–23,121 For example, in a group of patients with IBS according to the Rome I criteria and SIBO based on a positive LBT, Pimentel et al. demonstrated that the number of events of phase III of the MMC was lower in patients with IBS and SIBO than in the healthy controls (0.7 vs 2.2, p<0.001); the same was true for the phase III duration (305 vs 428 s, p<0.001).121
Numerous studies have suggested that patients with IBS have qualitative changes in the colonic flora. For example, there are descriptions of patients that can develop a proliferation of bacterial species that produce more gas, specifically methane. The presence of methanogenic flora in patients with IBS has been associated with a slower colonic transit time, rectal hyposensitivity, and altered intestinal motility.122–125 In a recent analysis of the microbiota in patients with IBS through the technique of pyrosequencing, Jeffery et al. demonstrated that 17 taxas are associated with a slow colonic transit time (including those of the following phylotypes: Euryarchaeota, those of the class: Methanobacteria, and those of the families: Methanobacteriaceae and Desulfohalobiaceae).60 Likewise, the presence of Proteobacteria is described as being associated with an increase in the pain threshold during rectal distension, evaluated using a barostat. In addition, the first evidence in IBS of the detection of different levels of acetic acid, propionic acid, and total fatty acids has been reported. The highest levels are associated with poor outcome IBS.
In summary, the evidence suggests that changes in the composition of the microbiota or its instability (dysbiosis) have an influence on the gastrointestinal physiology, producing abnormalities in visceral sensitivity and gastrointestinal motility. However, further studies are required in order to determine the effect of the microbiota on those sensory and motor alterations. On the other hand, it is not known whether these disturbances contribute to symptom generation or whether they are the consequence of primary motility disorders. Finally, it should be stressed that there are other factors that have an influence on the microbiota of patients with IBS, such as the type of diet (i.e. FODMAPs: fermentable oligosaccharides, disaccharides, monosaccharides and polyols) and the use of antibiotics.
3.66. Antimicrobials in the treatment of irritable bowel syndrome- •
In patients with non-constipation IBS, rifaximin at doses of 400mg TID for 10 days or 550mg TID for 14 days, is superior to placebo in the adequate response of global IBS symptoms and in abdominal bloating. It also improves pain and abdominal discomfort, as well as the consistency of loose/liquid stools during treatment and for up to 10 weeks post-treatment (level 1 b evidence, grade A recommendation).
- •
Rifaximin at a dose of 400mg TID for 7 days may neutralize the LBT in approximately half the patients with IBS, which is associated with reduced IBS symptom severity (level 4 evidence, grade C recommendation).
- •
The frequency of adverse events is similar between rifaximin and placebo, and the most frequent are: headache, upper respiratory tract infections, nausea, nasopharyngitis, diarrhea, and abdominal pain (level 1 b evidence, grade A recommendation).
- •
In the patients that require retreatment with rifaximin, effectiveness appears to be similar to that of the first treatment; however, further studies are required in order to determine the effectiveness of retreatment and the appropriate interval for carrying it out (level 4 evidence, grade C recommendation).
- •
Studies are required for evaluating the long-term safety and effectiveness of rifaximin in IBS (level 5 evidence, grade D recommendation).
Twenty articles that analyzed antibiotic therapy in IBS were identified, 5 reviews 15,127–130 and 15 original articles,18,33,131–143 all studies on adults, except one conducted on the pediatric population.135 An additional original article that had been published in December 2013 was added 37 (Table 7).
Antibiotic therapy in IBS.
| Author,journal,year | Country | Type of study | Diagnostic criteria/Study groups | Treatment dose | N | Outcome variables | Results/Conclusions | LE |
| Rezaie et al.,Arch Med Sci,2010127 | Iran | Systematic review +meta-analysis | Any criteria IBS | Rifa 400 mgvsPbBID-TID x 7-10 days | 80vs74 | Efficacy of antibiotics in IBS | Rifa superior to Pb,clinical response in IBS: RR=2.04, (95% CI 1.23-3.40, p=0.0061);symptom response: RR=2.06, (95% CI 1.3-3.27, p=0.002) | 1a |
| Menees et al.,Am J Gastroente-rol,201215 | USA | Systematic review +Meta-analysis | Any criteria IBS | Rifa 400-550 mgvsPbBID-TID x 10-14 days | 895vs908 | Efficacy and tolerability of rifa in IBS | Global relief, rifa superior to Pb: OR=1.57, (95% CI: 1.22-2.01); therapeutic gain: 9.8, NNT: 10.2;Abdominal bloating: OR=1.55, (95% CI: 1.23-1.96); therapeutic gain: 9.9, NNT: 10.1; adverse events: rifa=Pb | 1a |
| Schmulson, Chang,Aliment PharmacolTher,2011129 | Mexico,USA | Systematic review | Any criteria, abdominal bloating | Rifa 400-550 mgvsPbBID-TID x 7-14 days | 704vs708 | Efficacy in abdominal bloating | Rifa is effective in abdominal bloating improvement in non-constipation IBS | 1a |
| Fumi, Trexler, Ann Pharmacol, 2008128 | USA | Systematic review | Any criteriaIBSwith or without SIBO | Rifa 400 mgvsPbBID-TID x 7-10 days | 113vs30 | Efficacy of rifa in IBS symptoms | A third of the IBS patients show clinical improvement with rifa, particularly if they have SIBO | 2a |
| Kwon et al.,Korean J Gastroente-rol,2011130 | SouthKorea | Review | Rome I or II IBS | Rifa,neo,other antibiotics,controls | 127,44,61,63 | Evidence-based consensus and the Delphi Method | A short cycle of non-absorbable antibiotics (rifa or neo) can improve the overall symptoms of IBS, particularly in IBS-D | 3 |
| Scarpellini et al.,Aliment Pharmacol Ther,2007133 | Italy | RCT | SIBO+Rome II IBS | Rifa 400mg TIDvsRifa 400-800-400mg x 7 days | 33vs30 | GBT | GBT normalization,rifa-1200: 58% vs rifa-1600: 80%, (p<0.05) | 1b |
| Pimentel et al.,New Eng J Med,2011134 | USA | RCT | Rome IIIBS Non-C | Rifa 550 mgvsPb,TID x 14 days, follow-up for x 10 weeks;2 studies | Target 1309vs314Target 2315vs320 | % of adequate relief of overall symptoms in 2/4 weeks (weeks 3-6), daily symptom intensity | Adequate improvement,rifa: 40.7 vs Pb: 31.7, (p<0.001); abdominal bloating,rifa: 40.2 vs Pb: 30.3 (p<0.001); daily intensity (overall symptoms, abdominal pain, bloating, stool consistency),rifa > Pb (all significant) | 1b |
| Pimentel et al.,Am J Gastroente-rol,200318 | USA | RCT | Rome I IBS | Neo 500 mgvsPbBID x 7 days | 55vs56 | Improvement >50% in composite score (pain, diarrhea, constipation), bowel habit normalization | Improvement > 50%,neo: 35.0±5.0% vs Pb: 11.4±9.3%, (p<0.05);bowel habit, neo: 40.1±5.3% vs Pb: 15.1±3.6%, (p<0.001);IBS + LBT, improvement >50%, neo: 35.4±5.6% vs Pb: 3.7±10.6%, (p<0.01) | 2b |
| Pimentel et al., Dig Dis Sci,2006138 | USA | RCT | Rome I IBS-C | Neo 500 mgvsPbBID x 10 days | 20vs19 | % of global improvement, constipation and/or abdominal pain, constipation improvement in CH4+ | Global improvement,neo: 36.7±7.9 vs Pb: 5.0±3.2%, (p<0.001);constipation, neo: 32.6±9.9% vs 18.7±7.2%, (p=0.26);CH4+, neo: 44.0±12.3% vs Pb: 5.0±5.1%, (p=0.05) | 2b |
| Pimentelet al.,Ann Intern Med,2006131 | USA | RCT | Rome I IBS | Rifa 400 mgvsPbTID x10 days & follow-up x 10 weeks | 43vs44 | Global improvement, secondary symptoms (pain, bloating, diarrhea, constipation) | Global improvement,rifa: 36.40±31.46% vs Pb: 21.00±22.08% (p<0.020);only bloating improved (p<0.010) | 2b |
| Shararaet al.,Am J Gastroen-terol,2006132 | Lebanon | RCT | Bloating and flatulence-IBSRome II subgroup | Rifa 400 mgvsPb,BID x 10 days and follow-up x 10 days | 37vs30 | Subjective global relief (pain, bloating, number and frequency of bowel movements, incomplete evacuation) | At 10 days, patients improved with rifa: 40.5% vs Pb: 18.2% (p=0.04);ten-day follow-up, patients improved with rifa: 27.0 vs Pb: 9.1%, (p=0.05) | 2b |
| Collins, Lin,J Pediatr Gastroen-terol Nutr, 2011135 | USA | RCT | Children with CAPRome II-IBSsubgroup | Rifa 550 mgvsPbTID x 10 days & follow-up x 2 weeks | 26vs15 | Symptoms(bloating, gas, incomplete evacuation, pain, diarrhea, constipation, urgency, mucus, straining, incontinence)VAS: 0-10, LBT | Symptoms,rifa=Pb;LBT normalization,rifa: 80% vs Pb: 86% | 2b |
| Cuoco et al.,Minerva Gastroente-rol Dietol,2006136 | Italy | Case series | IBS symptomsand+GBT | Rifa 400 mgTID x14 days | 23 | GBT andpost-treatment symptomsvs basal | GBT,normalized in 82.6% (p<0.01); IBS symptoms disappeared, in 42%, (p<0.05); diarrhea, bloating, and abdominal pain improvement,(all: p<0.05) | 4 |
| Majewski et al.,Adv Med Sci,2007137 | USA | Case series | Rome II IBSand+GBT | Rifa 200 mgQID x 30 days | 8 | Overall improvement(bowel movement frequency, pain, bloating, gas) and GBT | Rifa normalized symptoms in 7 patients and GBT in 6 patients | 4 |
| Morken et al.,Scand J Gastroente-rol,2009139 | Sweden | Case series | Rome II IBS-Dpost-Giardia eradication | Rifa 200mg TID x 8 days + metro 400mg BID x 10 daysvslive fecal flora instilled in the duodenum | 18vs10 | Symptom score (nausea, pain, bloating, diarrhea, constipation, anorexia) and H+ through LBT | Symptoms, rifa+metro: tended to decrease at 4 weeks (p=0.07);fecal flora: diminished at 7 weeks (p=0.0009) but were the same 12 months later; H+, rifa: decreased at 90-120min, fecal flora: no changes,there was no group comparison | 4 |
| Weinstock et al,Dig Dis Sci,2008140 | USA | Case series | IBS symptomsand+LBTandrestless legs syndrome | Rifa 400mg,TID x 10 days. Then tegaserod 3mg + zinc 200mg + probiotic, QD x 30 days | 13 | N with global symptom and % of individual symptom improvement | Improvement above 80%: in 10 patients;complete resolution: in 5; abdominal pain: 74%; diarrhea: 73%; bloating: 70%; postprandial fullness: 65%; constipation: 64%; flatulence: 47% | 4 |
| Yang et al,Dig Dis Sci,2008141 | USA | Case series | Rome I IBSand+LBT | Rifa 400mg TID,neo,others: doxycycline, augmentin | 84,24,61 | % of responders (improvement > 50%),LBT | Rifa: 68% vs neo: 38% vs others: 44%, (both: p<0.01);normal LBT was a response predictor: 81% of responders (p<0.001) | 4 |
| Peralta et al.,World J Gastroenterol,200933 | Italy | Case series | Rome II IBS+LBT | Rifa 400 mgTID x 7 days | 54 | LBT normalization (N), symptom severity (Likert 0-4) | LBT normalization: 52,symptom severity,-LBT: 2.3±0.6 vs 0.9±0.8 (p=0.003);+LBT: no changes | 4 |
| Pimentel et al, Gastroen-terol Hepatol(NY),2009142 | USA | Case series | IBS Nonspecified criteriaandSIBO(LBT)+ Symptom resolution | Eryth 50mg,teg 2-6mg,eryth followed by teg,no treatment followed by eryth or teg, QD | 42,16,20,6 | Time until recurrence (days free from symptoms) | Eryth: 138.5±132.2 vs teg: 241.6±162.2, (p=0.004) vs no treatment (p=0.08); no treatment followed by eryth: 41.0±44.8 vs followed by teg: 195.6±153.3, (p=0.06); eryth followed by teg: extended 105.8±73.3 to 199.7±162.9 (p=0.04) | 4 |
| Pimentel et al.,Dig Dis Sci,2011143 | USA | Case series | Nonspecified criteriaIBS Non-C | Rifanonspecified dose | 148 | N with re-treatments,% of re-treatment response | 1 re-treatment: 71; 2: 48; 3: 22; 4: 7; 5: 4;improvement with first treatment: 75%; subsequent improvement: 75%;recurrence minimum: 4 months | 4 |
| Meyrat et al.,Aliment Pharmacol Ther,201237 | Switzerland | Case series | Rome III | Rifa 200 mgQID x 14 days | 106 | Symptom severity (Likert: 0-10) weeks 4 and 14 post-treatmentandLBT at 4 weeks (N=64) | Symptoms at 4 weeks,bloating: 5.5±2.6 vs 3.6±2.7, (p<0.001);flatulence: 5.0±2.7 vs 4.0±2.7, (p=0.015);diarrhea: 2.9±2.4 vs 2.0±2.4, (p=0.005);abdominal pain: 4.8±2.7 vs 3.3±2.5, (p<0.001);general well being: 3.9±2.4 vs 2.7±2.3, (p<0.001);LBT normalization: 86% | 4 |
The studies are organized from higher to lower level of evidence and then in the progressive order of the year of publication.
BID: twice a day; CAP: chronic abdominal pain; CH4: methane D: diarrhea; Eryth: erythromycin; GBT: glucose breath test; H+: exhaled hydrogen; IBS: irritable bowel syndrome; LBT: lactulose breath test; LE: level of evidence; N: number; Neo: neomycin; 95% CI: 95% confidence interval; NNT: number needed to treat; OR: odds ratio; Pb: placebo; QD: once a day; QID: 4 times a day; RCT: randomized controlled trial; Rifa: rifaximin; RR: relative risk; SIBO: small intestinal bacterial overgrowth; Teg: tegaserod; TID: 3 times a day; VAS: visual analog scale
Basically 2 antibiotics have been studied in IBS: rifaximin and neomycin. Rifaximin is a semi-synthetic antibiotic, an analog of rifamycin, designed to have little gastrointestinal absorption. It inhibits the bacterial synthesis of RNA by binding to the RNA polymerase β subunit that is dependent on bacterial DNA.144 Its absorption is less than 0.4%, making it an almost completely luminal-acting antibiotic, and most of it is excreted in the fecal matter, unchanged. It has a broad spectrum of activity against Gram-positive, Gram-negative, aerobic, and anaerobic enteropathogens145–146 with a low probability of bacterial resistance.147–148 In vitro it induces CYP3A4, but its interaction with other medications is almost null.129
In the selected reviews,15,127–131 a short cycle of non-absorbable antibiotics, like rifaximin, has been recommended for improving global IBS symptoms.131 The authors of a systematic review with only 3 original articles on rifaximin treatment of IBS with or without SIBO concluded that rifaximin at a dose of 400mg BID for 7 to 10 days, improves IBS symptoms, regardless of whether SIBO is present or not.129 In 2 later systematic reviews with meta-analyses published 2 years apart, the second one with 10 times more patients treated with rifaximin vs placebo, it was concluded, and with a good level of evidence, that the antibiotic at doses of 400 to 550mg, 2 to 3 times/day, was twice as effective as the placebo at improving IBS symptoms.15,127 Additionally, rifaximin showed a therapeutic gain of 9.8 over the placebo and a number needed to treat (NNT) of 10.2 for global IBS improvement and very similar values for abdominal bloating improvement.15,127 In another systematic review on the treatment of abdominal bloating, it was concluded that rifaximin was superior to placebo in the proportion of patients with IBS-Non C that reported subjective improvement in abdominal bloating.129
The original articles analyzed rifaximin and neomycin, as well as a few other antibiotics. However, the studies have different designs and include retrospective studies, case series, and randomized controlled trials with placebo or other antibiotics and different doses. For example, rifaximin has been studied from doses of 200mg QID,137 400mg BID or TID for 7 to 14 days, to 550mg TID for 14 days.15 Likewise, the outcome variables analyzed were very different in each of the studies, from global IBS improvement to improvement of secondary symptoms such as pain and/or abdominal bloating, to the frequency and consistency of bowel movements.131,132,134 The effect of rifaximin on GBT136,137 or LBT33 has been evaluated as well. These differences in the studies make it difficult to arrive at a conclusion. Nevertheless, the best evidence comes from the recent Target 1 and Target 2 studies by Pimentel et al., with more than 1,200 patients between the 2 investigations.134 They show that rifaximin at a dose of 550mg TID for 14 days in patients with IBS-Non C by Rome II criteria resulted in a greater proportion of patients with adequate relief from IBS symptoms, abdominal bloating, daily symptom intensity, abdominal pain, and stool consistency.134 In the follow-up at 10 weeks post-treatment, adequate relief defined as the subjective report of symptom improvement in at least one of every 2 weeks, rifaximin remained significantly superior to placebo. It is worth noting that it had previously been reported that at lower doses, such as 400mg BID or TID for 10 days, rifaximin was also superior to placebo in the percentage of patients that reported overall improvement of IBS.131–132 Regarding secondary effects, in the Target 1 and 2 studies, which are the largest, frequency was similar to the placebo (1.6% with rifaximin and 2.4% with placebo) and the main effects in order of frequency were headache, followed by respiratory tract infections, abdominal pain, nausea, and diarrhea.134
Furthermore, rifaximin can neutralize LBT in 52% of the patients with Rome II-IBS and in this subgroup symptom severity improved, but the corresponding study was not controlled,33 and neither were those that evaluated the effect on GBT.136,137 Regarding the effect on children, a dose of 550mg TID for 10 days showed no differences from the placebo or in LBT normalization, which was achieved in only 20%.135 This suggests that children most likely require higher doses or a different type of antibiotic, probably due to a more resistant microbiota. In reference to rifaximin retreatment, only one retrospective study analyzed this modality; patients treated up to 5 times had a mean interval of symptom recurrence of 4 months.143 Effectiveness was 75%, similar to that of the first treatment. However, well- designed studies are required in order to determine how often rifaximin can be repeated.143 Finally, no studies have evaluated the long-term effects of rifaximin in IBS.
Regarding neomycin, it is a systemic aminoglycoside that has been evaluated in 2 original studies on IBS,18,138 both of which are randomized and controlled with placebo. At a dose of 500mg BID for 7 to 10 days in patients with IBS in general in one study, and IBS-C by Rome I criteria in the other, neomycin was superior to the placebo in the percentage of patients, mainly those with a positive LBT, that reported improvement in a composite score of symptoms including abdominal pain, diarrhea, bloating, and bowel habit.18 Neomycin normalized LBT in only 20% of the patients, but in the methane-positive patients, the percentage that reported improvement in regard to constipation was 9 times higher with neomycin than with placebo.138 Despite this, neomycin is not an ideal drug for IBS because of its characteristics in relation to systemic absorption and its safety spectrum.
With regard to other antibiotics, a retrospective study was conducted that compared rifaximin with neomycin, doxycycline, and amoxicillin-clavulanic acid that were used in the management of the treatment and retreatment of SIBO in patients with IBS;141 however, these agents were not as effective as rifaximin. Erythromycin has also been studied, evaluating the number of days until IBS symptom recurrence after LBT neutralization, but it was much less effective than tegaserod.142 And finally, rifaximin together with metronidazole has been evaluated in post-giardiasis-IBS, but no conclusion can be reached in relation to this study.139
4Financial disclosureThe meetings that took place for the elaboration of this document, transportation, and accomodations were all made possible thanks to the economic support received from Alfa-Wasserman. All the authors received an honorarium for their participation.
5Conflict of interestMax Schmulson has been a consultant for Procter and Gamble, Novartis, Schering-Plough, Alfa-Wasserman, Janssen, Nestle Ltd, and Almirall. He has been a speaker for Takeda México SA de CV, Schering-Plough, Mayoli-Spindler, Alfa-Wasserman, Janssen, and Novartis. He has received research support from Takeda México SA de CV and Nestlé Ltd.
María Victoria Bielsa has been a consultant for Alfa-Wasserman, Takeda México SA de CV, and Astra Zeneca. She has been a speaker for Takeda México SA de CV, GlaxoSmithKline México, Mayoli-Spindler, and Alfa-Wasserman.
Ramón Carmona-Sánchez is a member of the Advisory Counsel of Takeda Pharmaceuticals, Alfa-Wasserman, and Mayoly-Spindler. He has been a speaker for Nycomed-Takeda, Mayoly-Spindler, Asofarma, and Janssen-Cilag.
Angélica Hernández has been a consultant for Alfa-Wasserman and Astra Zeneca and a speaker for Astra Zeneca, Menarini, Boston Scientific, Olympus, and Ferring.
Aurelio López-Colombo has been a consultant for Novartis and a speaker for Takeda, Alfa Wasserman, Janssen, and Novartis.
Yolanda López-Vidal has been a consultant for Alfa-Wasserman and she has received research support from and been a speaker for Nestlé Ltd.
Mario Peláez-Luna has no conflict of interest to declare.
José María Remes-Troche is a member of the Advisory Counsel for Takeda Pharmaceuticals, Alfa-Wasserman, Almirall, and Janssen. He has been a speaker for Nycomed-Takeda, Advance Medical, Endomedica, Astra-Zeneca, and Bristol-Myers-Squibb. He has received research funding from Sanofi-Pasteur, Asofarma, and Astra Zeneca.
José Luis Tamayo is a member of the Advisory Counsel for Alfa-Wasserman, Malloly-Spindler, and Takeda. He has been a speaker for Astra Zeneca, Malloly-Spindler, Janssen, and Takeda Pharmaceuticals.
Miguel A. Valdovinos has been a member of the Consultancy Counsels of Takeda, Malloly-Spindler, Almirall, Sanofi, and Danone. He has been a speaker for Takeda, Almirall, Merck, Ferrer, Janssen, Endomédica, Novartis, and Danone and has received research support from Endostim Inc, Ferrer, and Danone.
The authors wish to thank Lenin Mejía-López for his help in organizing the selected references for the review and to Angélica L. Serrano Ahumada of the Department of Experimental Medicine of the Faculty of Medicine at the UNAM for her invaluable editing skills in relation to this manuscript.
Please cite this article as: Schmulson M, Bielsa MV, Carmona-Sánchez R, Hernández A, López-Colombo A, Vidal YL, et al. Microbiota, infecciones gastrointestinales, inflamación de bajo grado y antibioticoterapia en el síndrome de intestino irritable. Una revisión basada en evidencias. Revista de Gastroenterología de México. 2014;79:96–134.

